Overview
Note: This post is generally about applications that have ingress enabled.
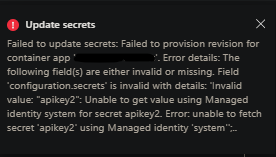
When deploying an application or doing something that would create a revision, there is a chance you may see the below message in certain circumstances, which may show directly in the portal via a “popout” or in the ContainerAppSystemLogs / ContainerAppSystemLogs_CL Azure Monitor and Log Analytics tables, respectively.
-
Example:
The TargetPort [ingress_port] does not match the listening port [application_container_port].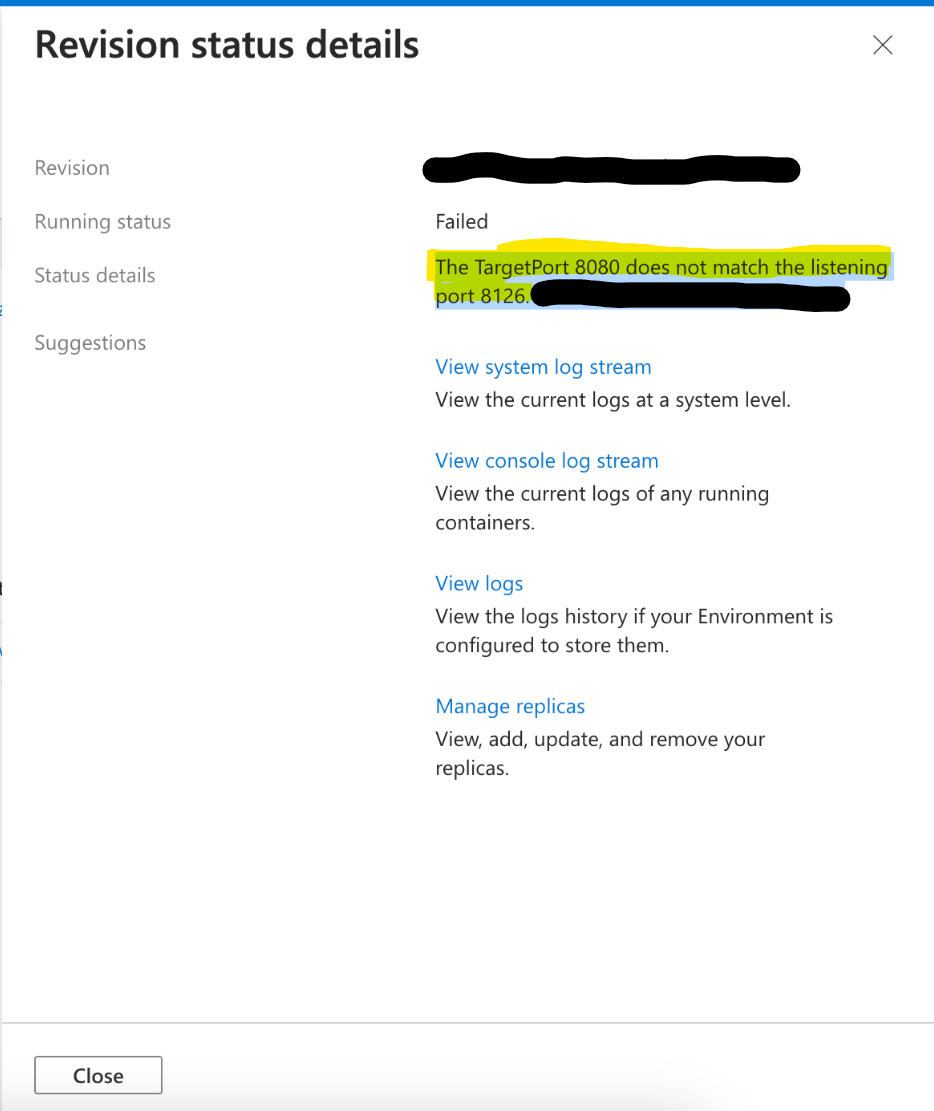
This is done by platform logic that checks the “ingress” port defined in the Ingress blade on a Container App versus the application listening port(s).
Note, that this is just a warning, in itself - and the message itself is not fatal. If anything, this would be a symtpon of other problems or behaviors described in the next section.
Why do I see ports that I’m not exposing?
In the message of The TargetPort [ingress_port] does not match the listening port [application_container_port]., the [application_container_port] may be a value that is not what you’re actually exposing from your application.
There could be a few different reasons for this, but they’re generally the same in the sense that:
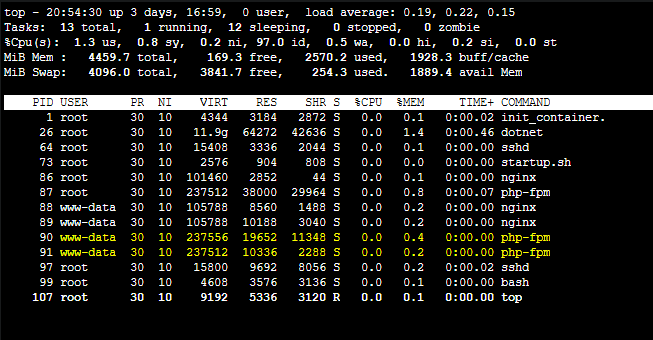
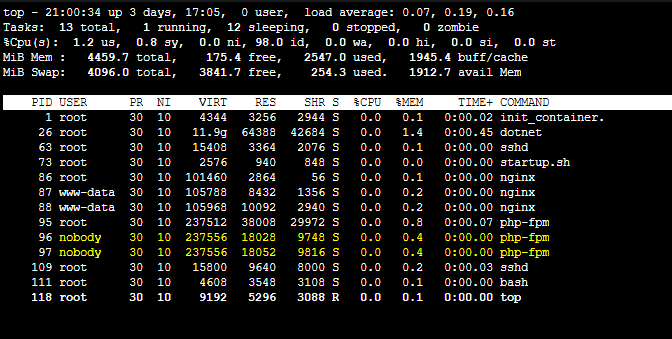
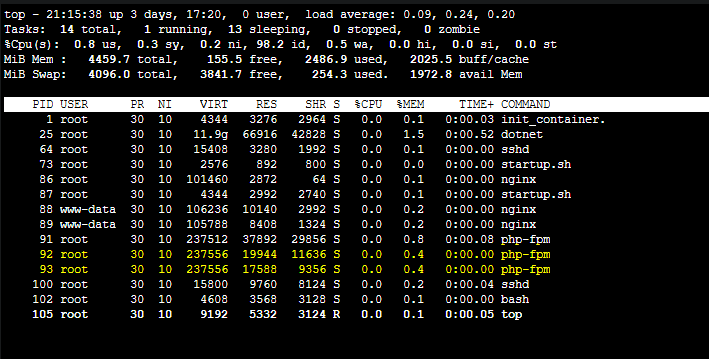
- Your application port is not opened yet - and you may have other services built into your image that may have opened ports before the application did. In the screenshots in this blog, port
8126is actually referring to DataDog - this was actively listening prior to the application’s web server opening and listening on it’s specified port - Your application port is not opened yet - and you may have other containers in your pod or replicas, such as Dapr (eg. port
3501), or others. These will be discovered and listed in the warning message at times.
Reasons why this may happen and resolutions
Port mismatch
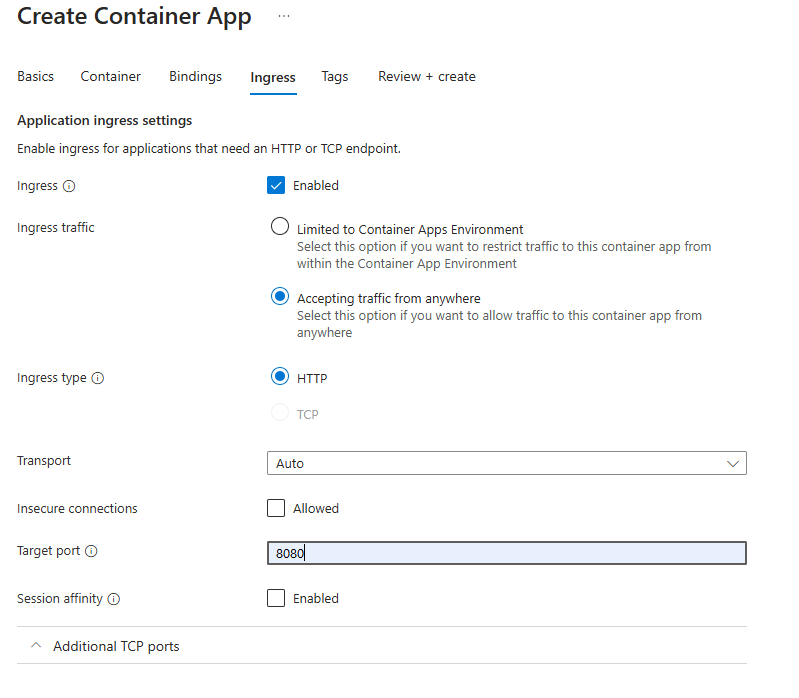
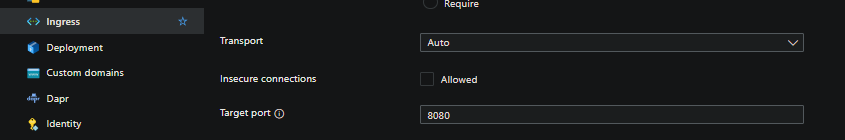
The most basic and potentially common reason is that your Ingress value simply doesn’t match what’s exposed either in your Dockerfile EXPOSE instruction, and/or, what port your application is listening on.
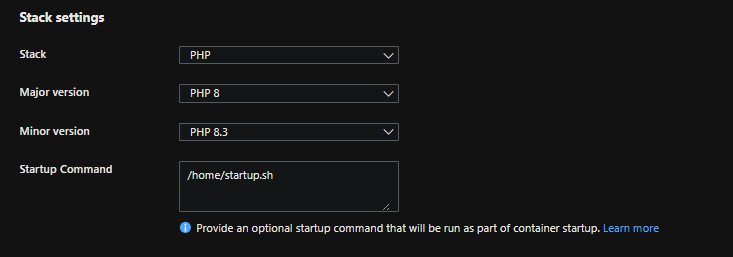
Take for example, our ingress is set to 8080
But our application is exposing 80 in its Dockerfile
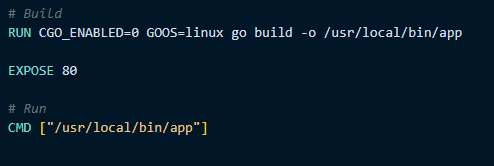
This would be a cause for this error. Additionally, if you were listening on 80 (or some other port aside from 8080) within your application (but omitting the EXPOSE instruction), while your ingress was still set to 8080 - this would also be another reason for this warning:
app.Listen(":80")
As a resolution - ensure your exposing and listening on the correct application port.
Slow starting applications
Applications that take a while to start (eg. tens of seconds, or even longer) may have this warning populate. This could be due to various lifecycle logic upon startup, such as database migrations or processing, etc. - or more adverse issues such as high CPU, which may exacerbated slow startup behavior.
Ultimately in this scenario - this is because the port the application is listening on would not have been opened yet, and given that, would trigger the warning.
- Aside from testing locally, you can gauge startup time via
ContainerAppConsoleLogs_CLfor applicationstdout/errandContainerAppSystemLogs_CLfor general pod and container lifecycle events. You can use logstream as well, but structured logs via Azure Monitor or Log Analytics are easier to review. - Container Apps - Demystifying restarts can be reviewed to help show general pod and container lifecycle events.
- To prevent any further issues with longer startup time, tweak Health Probes as needed to avoid pods/replicas ultimately being deemed unhealthy until any long running startup logic completes, although this will not necessarily clear the warning about the ports.
- You can confirm in the Metrics blade on a Container App what kind of CPU utilization the applicaiton is using upon startup. If this is at a high percentage of the
cpualloted to that specific containeer in a pod, then it would be best to profile the application or increase thecpuresource to higher levels. Review the Performance section here.
Container crashes and ‘backoff-restarts’
A certain scenario may appear where The TargetPort [port] does not match the listening port [app_port] is displayed in the portal - but at the same time, the container happens to be crashing/exiting/failing to startup.
As explained above, this “port” message may show in some cases. But again, this message is rather a warning instead of being directly fatal.
Currently, in the portal - if both of these combination of things (port discovery message, container exit/start failure) are happening at once, it may look like the port discovery feature is the reason for the failure - however, it is not.
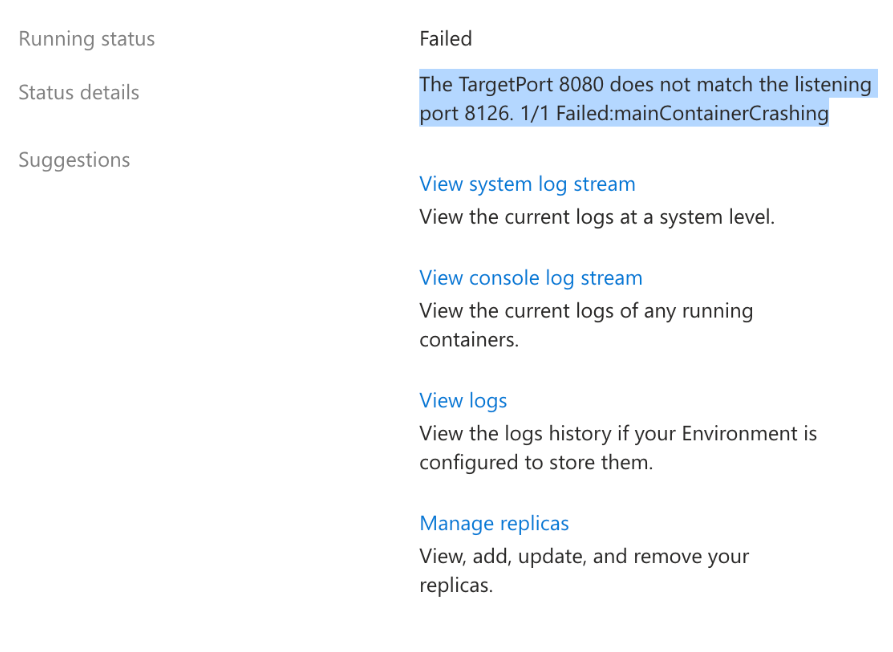
The root cause in this case is the fact the container in said pod is failing to start or exiting - therefor to work towards a resolution this should be investigated as an “app down” scenario.
Additionally, Health Probes that are pointing to the wrong port, not returning a response in time, not returning a HTTP 200-399 response, or generally unsuccessfull, will cause this behavior too.
You can review Container Apps - Backoff restarts and container exits for more information. Given that container exits or start failures can happen for many reasons, reviewing application and system logs are key.
]]>