Troubleshooting Azure Functions Javascript
You can find all the best practices for reliable Azure Functions in this reference, this blog post will complement some of these best practices and how you can troubleshoot deployments and performance scenarios.
Deployment
Before troubleshooting, you need to identify where is your source code and which is the build provider that you are using. Check this reference for more information: Identify the build provider.
Also based on the hosting plans for Azure Functions there are supported ways to deploy. Check this reference for more information: Deployment technologies in Azure Functions.
- If you are using Oryx builder or Remote build on Linux (using
ENABLE_ORYX_BUILD=trueandSCM_DO_BUILD_DURING_DEPLOYMENT=true), here is a compilation of the most common scenarios. - If you are building your assets with external agents as (GitHub Actions, Azure DevOps, ZipDeploy), review some of the recommendations and scenarios.
Performance
You can find a guidance and best practices to improve the performance and reliability of your Azure Functions in this reference when building and architecting your solutions.
To complement this article you can find extra configurations and testing scenarios described below:
Sync vs Async
To understand the differences between using async vs sync operations, you need to be familiar with Blocking vs Non-Blocking (Event Loop, libuv) concepts and how Event loop works.
Asynchronous programming is highly recommended as best practice especially when blocking I/O operations are involved.
Here is a quick example between executing Async and Sync methods and how that impacts in response times.
Load testing was done using 20 max requests and 20 concurrent users.
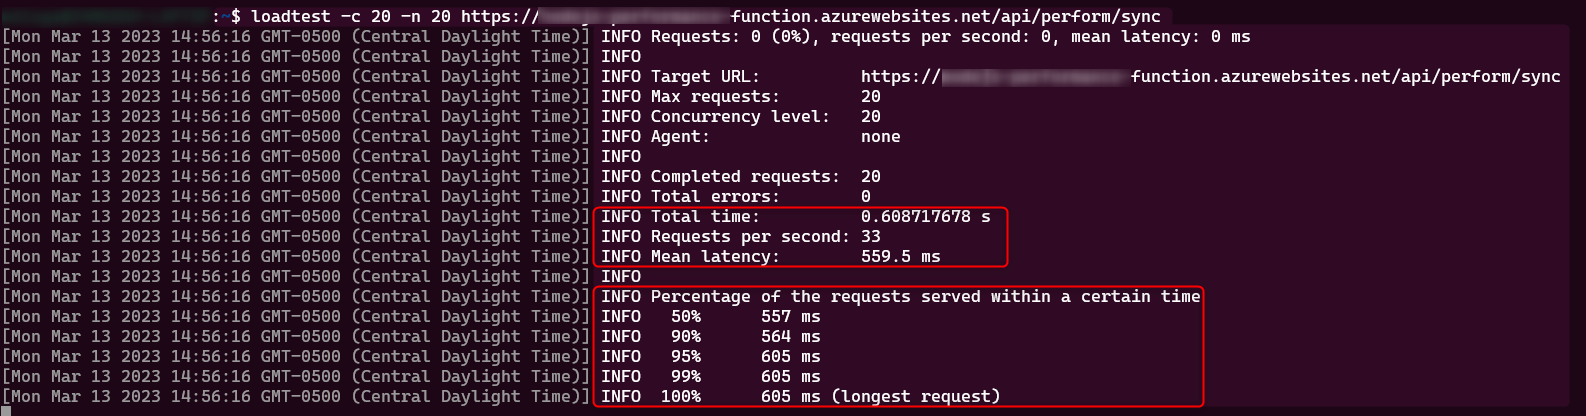
Sync
function ReadFile(context){
    var path = context.executionContext.functionDirectory;
    return fs.readFileSync(path + "/content.txt", "utf8");
}
Load testing result:
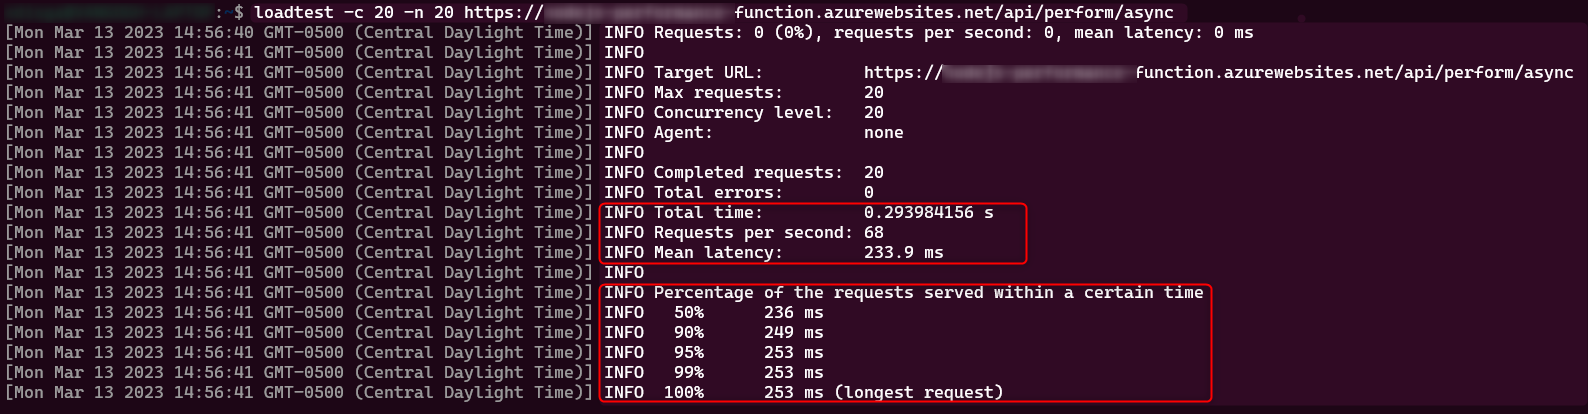
Async
async function ReadFileAsync(context){
    var path = context.executionContext.functionDirectory;
    fs.readFile(path + "/content.txt", "utf8", (error, data) => {
        if (error) throw error;
        return data;
    });
}
Load testing result:
Highly recommend to check this reference Don’t Block the Event Loop (or the Worker Pool) since these asynchronous requests will also be executed on the Event Loop.
CPU intensive
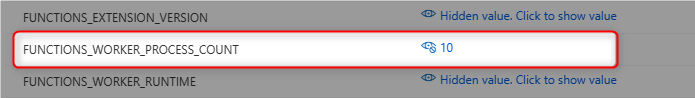
Since Node.js is single-threaded runtime, that means that you will get one node.js process running per host. You can increase the number of processes, aka “worker processes”, as similar approach as you were doing clustering and distribute the invocations through those workers. You can increase the number of worker processes up to 10, you can configure it depending on your hosting plan and CPU cores.
To increase the worker processes number, you can add this app setting: FUNCTIONS_WORKER_PROCESS_COUNT=NumberOfWorkers
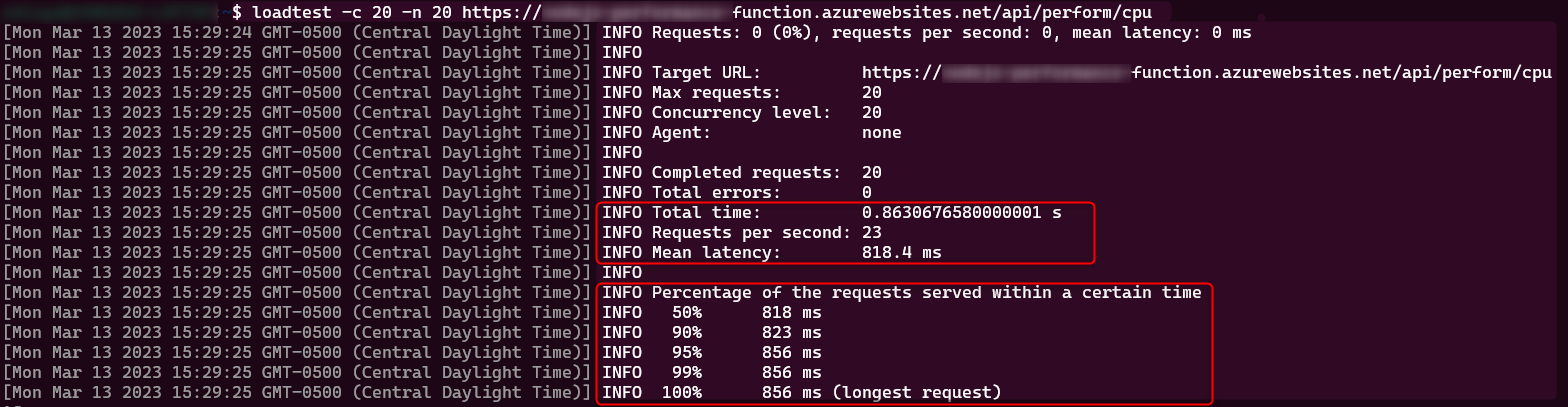
This code will simulate a High CPU scenario and understand the differences between using single vs multiple worker processes.
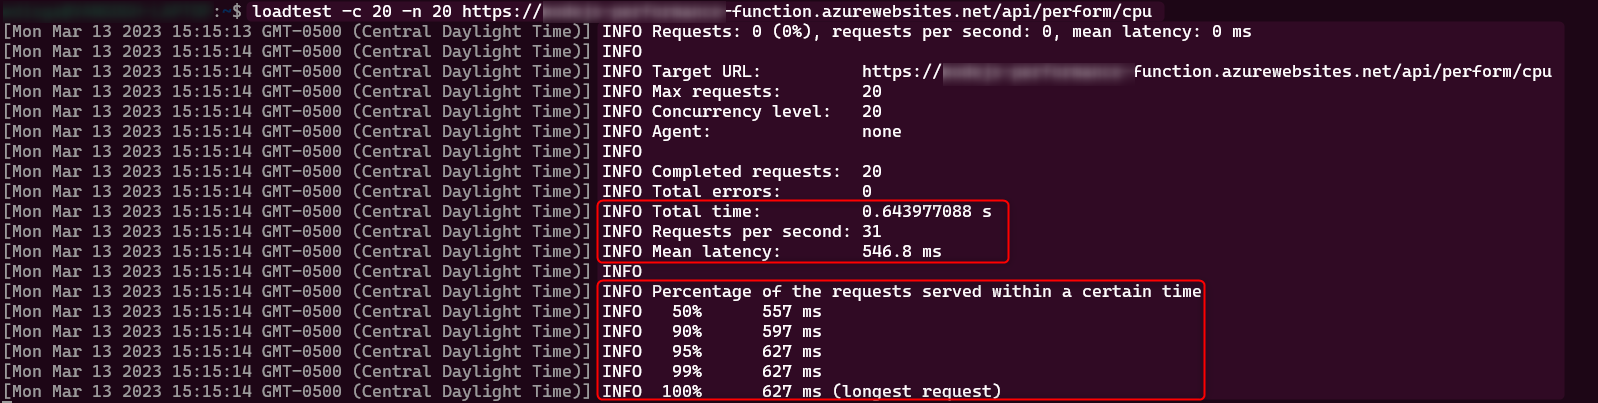
Load testing was done using 20 max requests and 20 concurrent users.
async function fibonacci(n){
    if(n < 1){return 0;}
    else if(n == 1 || n == 2){return 1;}
    else if(n > 2){return await fibonacci(n - 1) + await fibonacci(n-2);}
}

await fibonacci(25);
Load testing result:
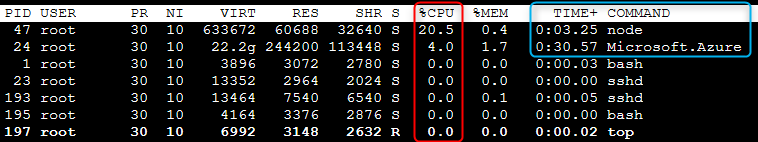
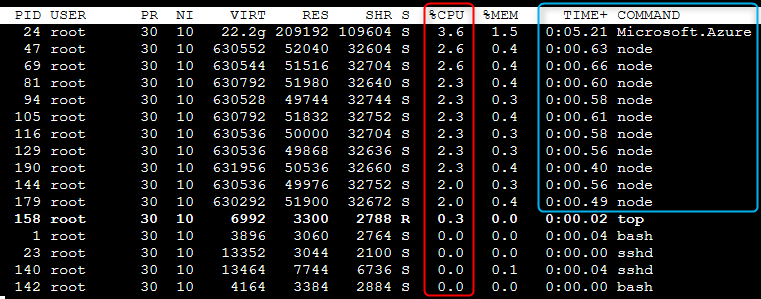
Top Linux command:
Adding FUNCTIONS_WORKER_PROCESS_COUNT=10
Load testing result:
Top Linux command:
If your implementation is taking a considerable amount of CPU, it is highly recommended to profile the code once the node.js process has been idenfied taking high cpu. Review Profiling and debugging tools section for CPU profiling.
Memory consumption
The available memory will depend on the hosting plan, if your function is running on Consumption Plan, you will have until 1.5 GBs avaliable for your function. For Premium and Dedicate plan will depend on the SKU selected. You can review Service limits for more information.
Besides the SKU selected you need to take in consideration how much heap size limit is available for the current node.js version.
You can get the heap limit size running this code:
  const v8 = require('v8');
  var memory = v8.getHeapStatistics();
  console.log(`${Math.round(memory['heap_size_limit'] / 1024 / 1024 * 100) / 100} MB`);
| Node.js Version | Heap limit |
|---|---|
| 18.x | 4.0 GB |
| 16.x | 4.0 GB |
| 14.x | 4.0 GB |
| 12.x | 2.0 GB |
That means if you have a SKU with 8 GBs of RAM available, node.js process will be able to allocate until 4 GBs of RAM and then potentially crash with FATAL ERROR: CALL_AND_RETRY_LAST Allocation failed - JavaScript heap out of memory trying to allocate more than the heap limit size.
You can increase that number passing this argument --max-old-space-size=NumberOfMB through the following appsetting:
languageWorkers__node__arguments(For Linux Functions)languageWorkers:node:arguments(For Windows Functions)
languageWorkers__node__arguments=--max-old-space-size=7000
If your application is allocating a high amount of memory, then it is highly recommend to review, identify the reason and if possible redesign your architecture and use other services as Redis cache to save objects in memory and improve application performance.
To identify which objects are being allocated in the heap, review Profiling and debugging tools section for memory profiling.
Profiling and debugging tools
Profiling High CPU
There are different ways to profile a node.js application, using built-in V8 profilers or third-party libraries. The differences are the way you can control better what to profile. If you want to profile just a piece of code or specific it is recommended to use third-party libraries, but if you want to profile the entire application running a node process then it is recommend to use built-in V8 profiler.
You can find more information about the different ways to profile for Azure Functions running on Windows and Linux here.
In this blog we are covering just node –prof V8 profiler.
To pass any argument to the node.js process you can use this app setting:
languageWorkers__node__arguments(For Linux Functions)languageWorkers:node:arguments(For Windows Functions)
Follow the next steps to configure/capture/review a profiler trace:
-
To active the V8 profiler you can pass the following arguments:
--prof --logfile=/home/Logfiles/v8-%p.logBy default prof v8 profiler will create a trace log with the following syntax
isolate-id-p-v8-p.log, it is called an isolate because the state of each V8 instance is isolated from all others, and it gets an ID assigned.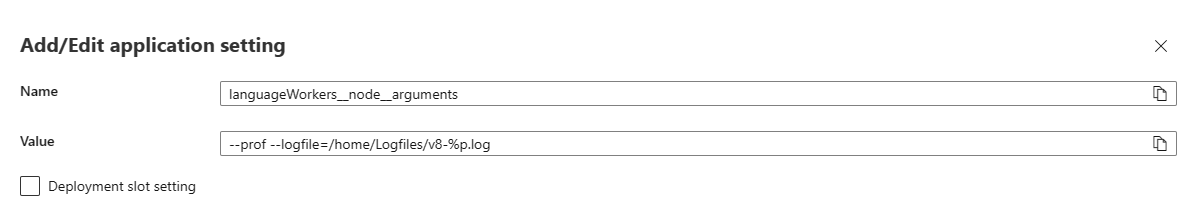
If you are using Consumption plan you can mount an external storage and redirect the profiler trace logs to the mount path, you can find an example here using azure cli.
- Reproduce the scenario to capture the information.
- Restart your Azure Functions app to stdout the information to .log file.
- Download (isolate-id-p-v8-p.log) file or files.
-
Run the following command locally with the same node version
node --prof-process isolate-id-p-v8-p.log > process.txt -
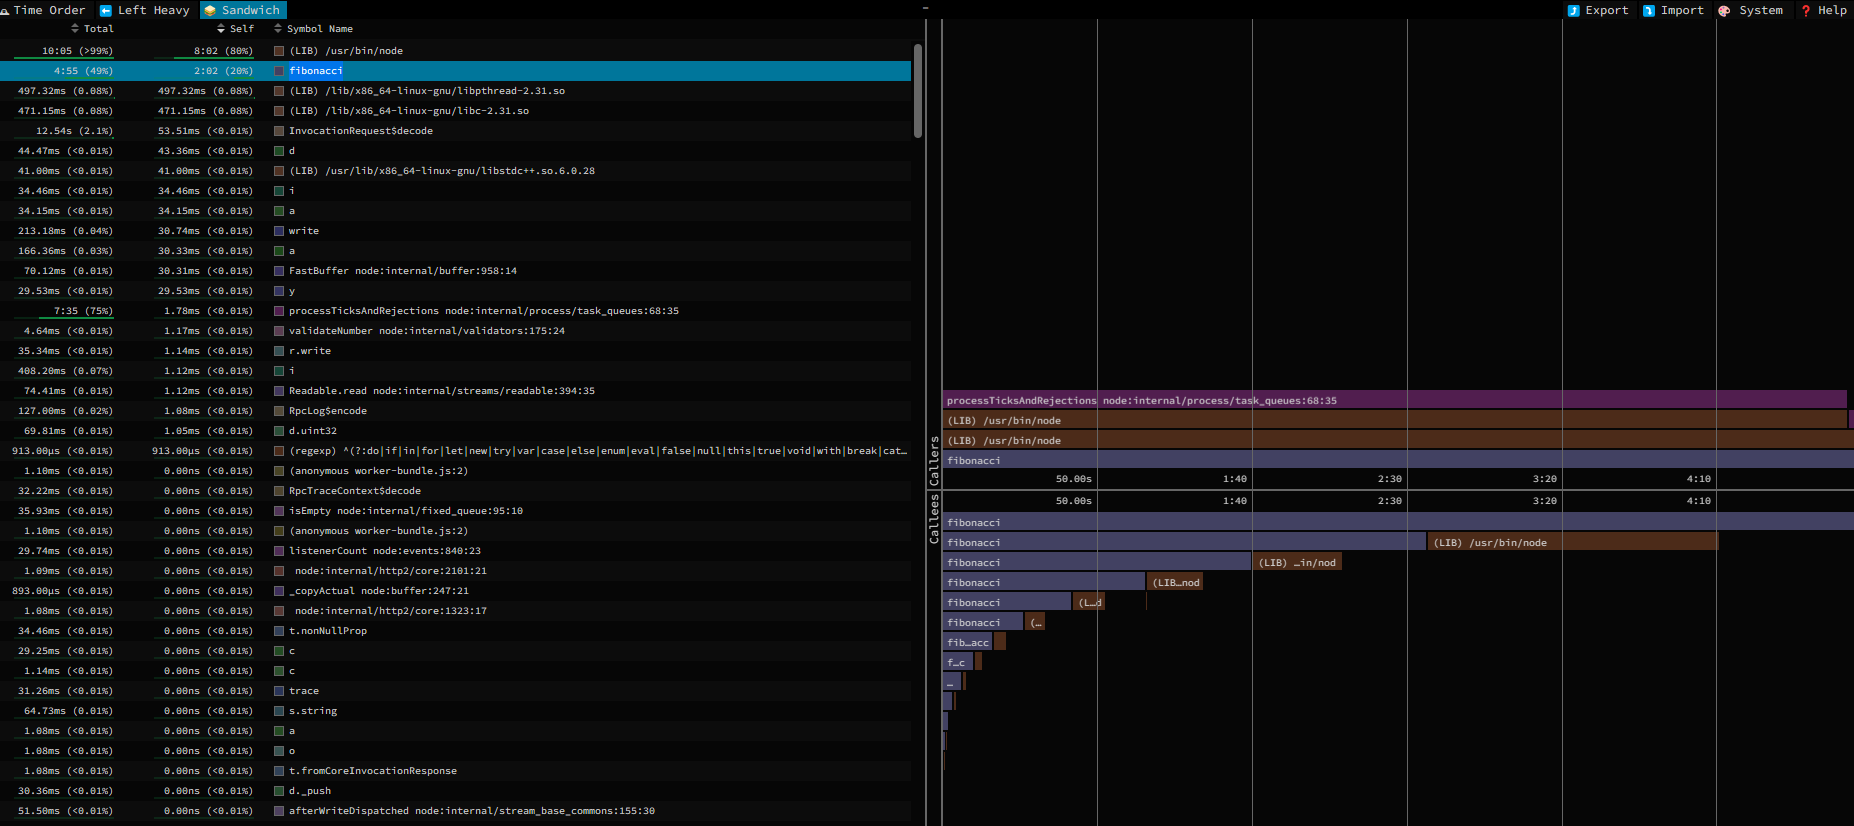
This will produce a similar output, where you can review which section is taking more CPU time.
Statistical profiling result from .\isolate-0x5957d20-47-v8-47.log, (83680 ticks, 4335 unaccounted, 0 excluded). [Shared libraries]: ticks total nonlib name 869 1.0% /usr/bin/node 131 0.2% /lib/x86_64-linux-gnu/libc-2.31.so 109 0.1% /lib/x86_64-linux-gnu/libpthread-2.31.so 15 0.0% /usr/lib/x86_64-linux-gnu/libstdc++.so.6.0.28 1 0.0% [vdso] [JavaScript]: ticks total nonlib name 78134 93.4% 94.6% LazyCompile: *fibonacci /home/site/wwwroot/API/index.js:3:19 81 0.1% 0.1% LazyCompile: *saveObjects /home/site/wwwroot/API/index.js:9:22 1 0.0% 0.0% RegExp: %([%dfijs]) 1 0.0% 0.0% LazyCompile: *i /azure-functions-host/workers/node/dist/src/worker-bundle.js:2:208082 1 0.0% 0.0% Function: ^set /azure-functions-host/workers/node/dist/src/worker-bundle.js:2:432696 1 0.0% 0.0% Function: ^o /azure-functions-host/workers/node/dist/src/worker-bundle.js:2:445882 1 0.0% 0.0% Function: ^c.uint32 /azure-functions-host/workers/node/dist/src/worker-bundle.js:2:420493 [C++]: ticks total nonlib name [Summary]: ticks total nonlib name 78220 93.5% 94.7% JavaScript 0 0.0% 0.0% C++ 241 0.3% 0.3% GC 1125 1.3% Shared libraries 4335 5.2% Unaccounted .... -
You can use flamegraphs with speedscope or flamebearer. These steps applies for both:
 npm install -g speedscope

 node --prof-process --preprocess -j isolate-id-p-v8-p.log | speedscope -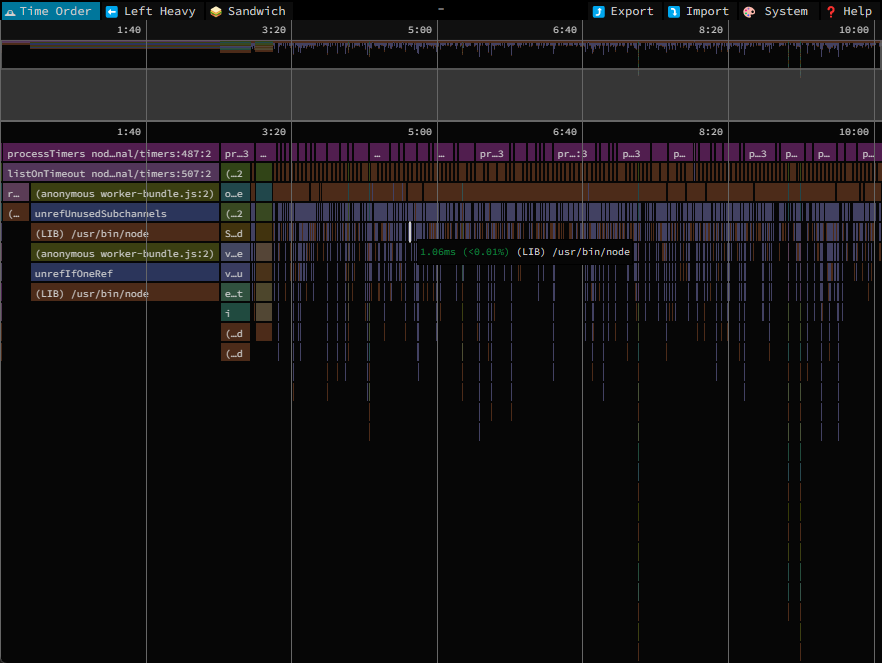
Note: To get successfull graphs you need to have the same node.js version in local environment.
If you want to profile in a local environment check the Local Debugging section to apply the same configuration steps.
Profiling High Memory
There are different ways to profile a node.js application, using built-in V8 profilers or third-party libraries. The differences are the way you can control better what to profile. If you want to profile just a piece of code or specific it is recommended to use third-party libraries, but if you want to profile the entire application running a node process then it is recommend to use built-in V8 profiler.
You can find more information about the different ways to profile for Azure Functions running on Windows and Linux here.
In this blog we are covering just node –heap-prof V8 profiler
To pass any argument to the node.js process you can use this app setting:
languageWorkers__node__arguments(For Linux Functions)languageWorkers:node:arguments(For Windows Functions)
Follow the next steps to configure/capture/review a profiler trace:
- To active the V8 profiler you can pass the following arguments:
--heap-prof --heap-prof-dir=/home/Logfiles -
To generate the heap profile, you need to implement a way in code to end the node.js process with
process.exit():process.exit(0);Unfortunately restarting the app or killing the process will not generate the profile output.
- Reproduce the scenario and then call code to exit the process. A new file will be generated having this syntax:
Heap.yyyymmdd.hhmmss.pid.tid.seq.heapprofile. - Download the file or files.
-
Use Chrome/Edge to analyze it. You can type in Chrome browser
chrome://inspect/or with Edgeedge://inspect, and then click onOpen dedicated DevTools for Node. Then selectMemorytab and load the*.heapprofilefile. And use different views as Chart, Heavy (Bottom up) or Tree to review and analyze the trace.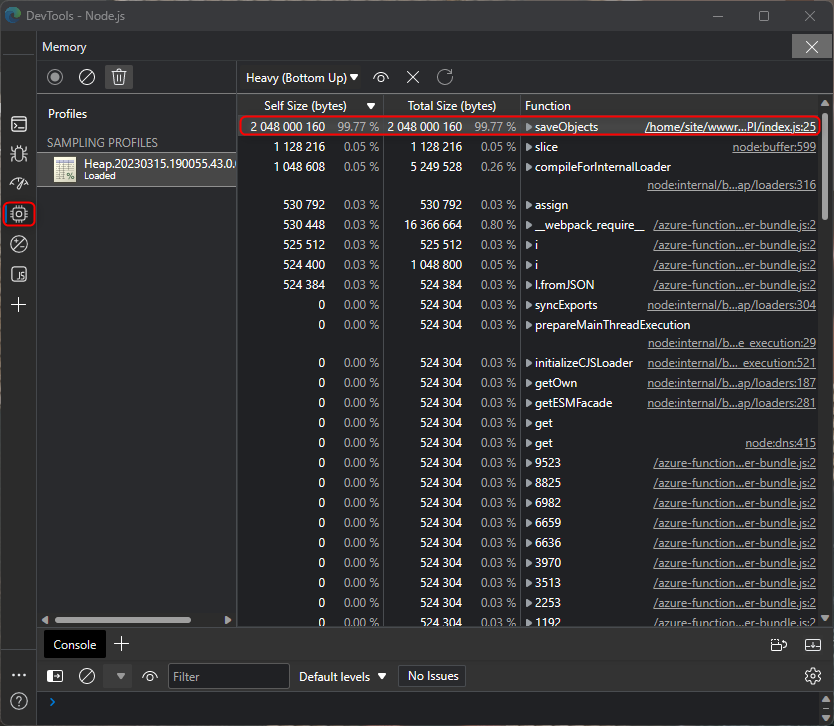
Note: If you want to profile in a local environment check the Local Debugging section to apply the same configuration steps with
node --inspectand Allocation instrumentation timeline.
Local Debugging
For local debugging, you need local.settings.json file with the following structure:
{
  "IsEncrypted": false,
  "Values": {
    "FUNCTIONS_WORKER_RUNTIME": "node",
    "AzureWebJobsStorage": "UseDevelopmentStorage=true",
    "languageWorkers:node:arguments": "--inspect=5858"
  }
}
And add this parameter "languageWorkers:node:arguments": "--inspect=5858"
You can review these references for more information:
Note: This is currently working for local environment
You have two ways to debug, using Visual Code or using (Edge/Chrome Dev tools)
Visual Code
-
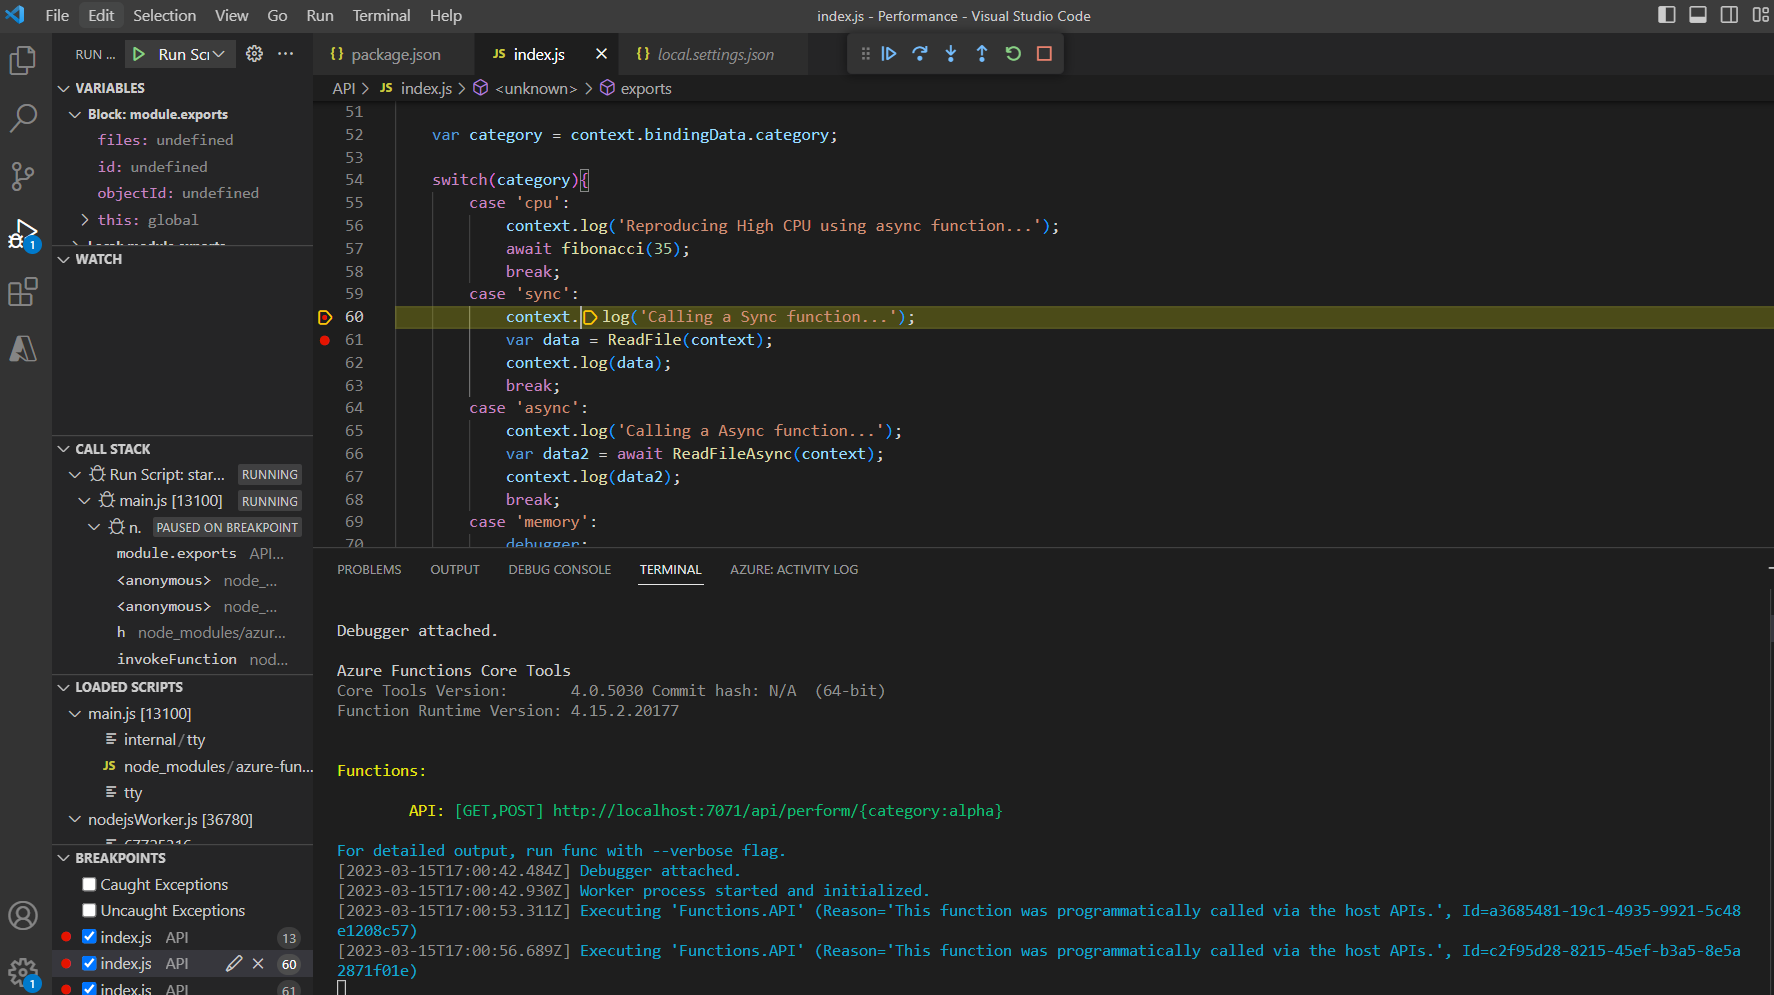
Just press F5 to start the debugger and then set breakpoints to stop.
Edge or Chrome Dev Tools
-
Add
debuggerline in the function you want to debug.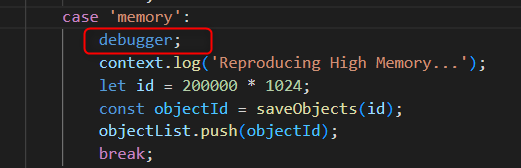
- Then run
func start - Browse through Edge Browser with
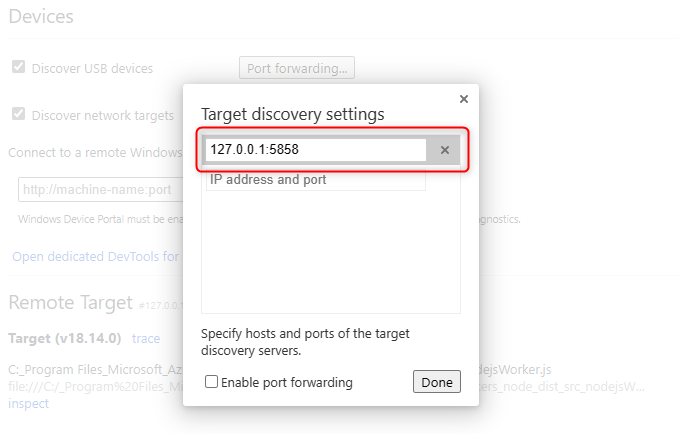
edge://inspect/#devicesor Chrome withchrome://inspect/#devices - Click in Configure
Discover network targetsand add127.0.0.1:5858and then click onDone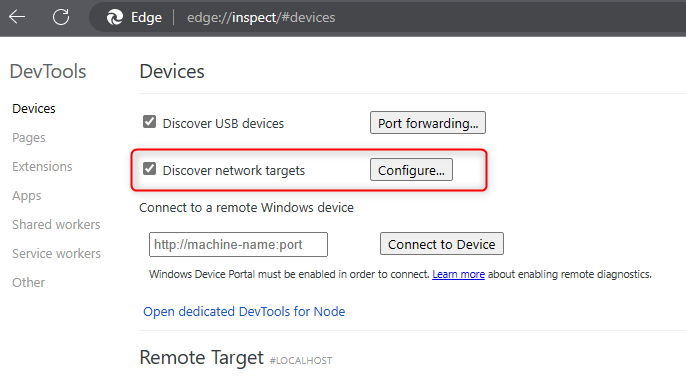
- After that you will see a
Remote Targetdisplayed below, click oninspectto open theSources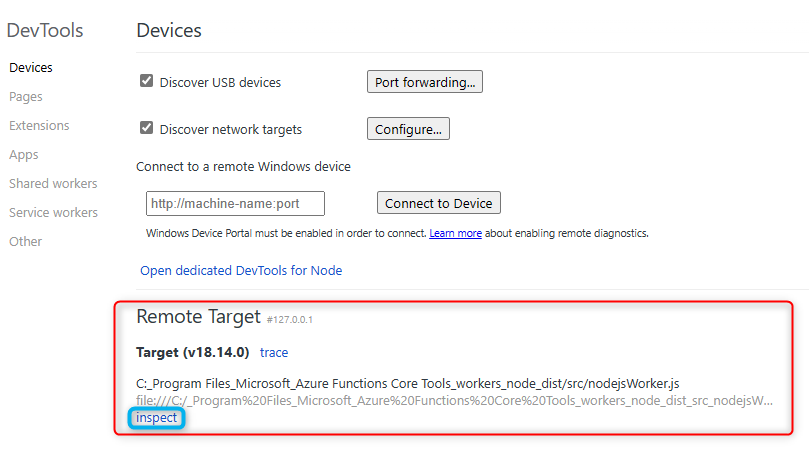
- Reproduce the issue and it will end in the
debuggerbreakpoint set before.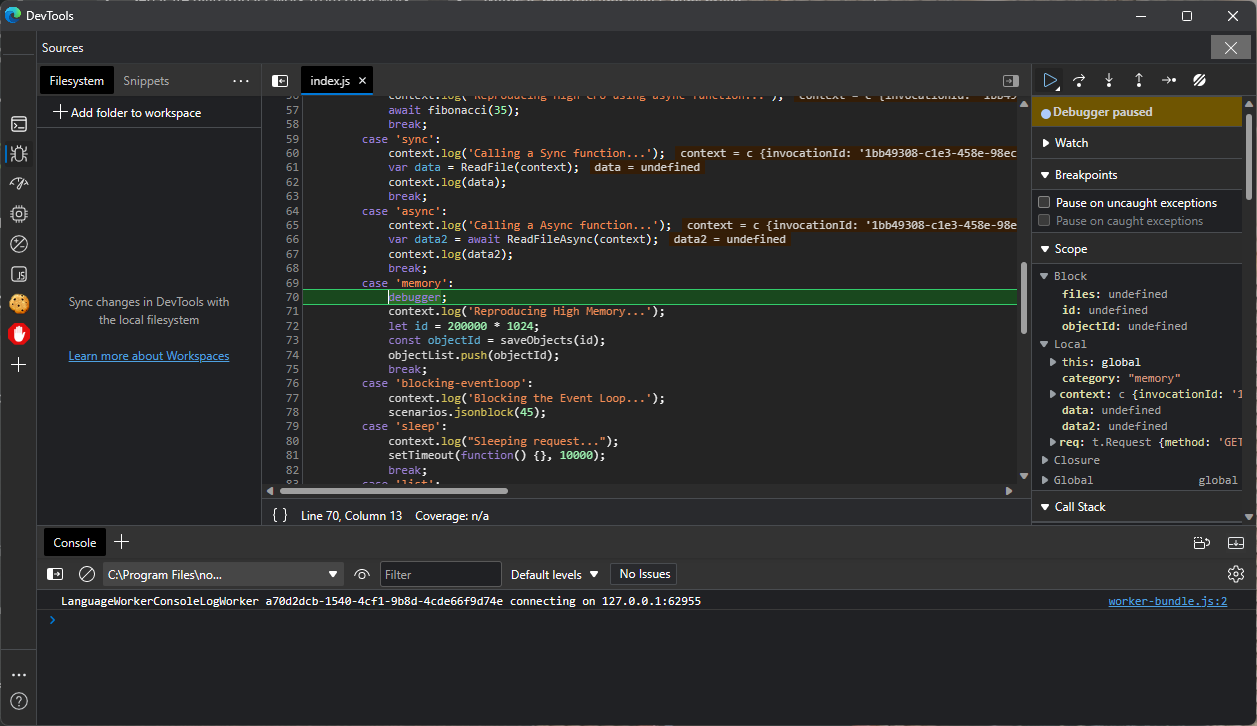
- Then you can continue with Debug toolbar to step into or step over.


