Troubleshooting ingress issues on Azure Container Apps
This post will cover troubleshooting various external ingress issues on Azure Container Apps.
Overview
Azure Container Apps handles ingress with Envoy as a proxy - this can handle HTTP 1.1 and HTTP2 traffic - as well as gRPC usage.
Sometimes, due to misconfiguration, application issues, or others - you may get error messages returned from Envoy. These messages may vary on what scenario is being encountered.
Common Errors
Common ingress pitfalls:
- Ingress port mismatch versus the application listening port. Or, the application is listening on
localhostinstead of binding to0.0.0.0. - External clients are blocked by NSG’s set on the environment subnet
- External clients may not be able to resolve DNS to applications in the environment
- Applications crashing which end up experiencing HTTP 5xx range of errors
- Requests taking too long, or, sites experiencing a large amount of requests which may trigger Envoy’s
overload. Use premium ingress for these situations. - Health Probes set with non-ideal settings for the application, which may cause container restarts due to persistent probe failures. Review Troubleshoot health probe failures in Azure Container Apps as well as Container Apps: Troubleshooting and configuration with Health Probes. Health Probes should be tweaked, if needed, based on the applications startup and runtime behavior. Technically this can be seen as a non-issue issue, however, this typically manifests as a range of HTTP 502/503/504 if a container fails probes enough times to be restarted.
When an application is crashing or failing to start - or - pods/replicas are failing to be created, for example, due to Maximum Allowed Cores exceeded for the Managed Environment, this will typically surface back as some HTTP 502/503/504. This may be conflated with an ingress issue, even though this is not. Since these types of issues are associated with Revisions in a degraded or failed state - it is best to review the top reasons associated with this by viewing this blog post here: Applications (and revisions) stuck in activating state on Azure Container Apps
Troubleshoot target port settings in Azure Container Apps
Review Troubleshoot target port settings in Azure Container Apps and Container Apps - ‘Target port does not match the listening port’
A common warning of TargetPort does not match the listening port can happen if:
- The port you specified for the application to listen on does not match the actual port the application server is running on
- The application is slow to start (thus slow to open its port)
- The application is failing to start
“.internal.” FQDN versus “appname”
On Container Apps, you can make inter-cluster requests to other applications, which is called out in Domain names.
- The
.internal.FQDN (eg.appname.internal.funnyname123abc.<region>.azurecontainerapps.io) can only be used to call between applications in the cluster. This will show as “limited to environment”. Routing through this method passes through Envoy proxies in the environment and stays in the environment. - You can call to another app within the environment - for example,
curl -v myotherapp. This uses a helper proxy in the same pod that the application container is running in.
Calling to another app simply by its name is a nice helper. If you happen to notice issues calling to the upstream application in this manner and has been determined it is not application related, try using the .internal. FQDN of the upstream application instead.
Common issues:
- HTTP 403 is returned when accessing the application. If you’re requesting an
.internal.FQDN (or via appname) and the request is outside of the environment, this will return a HTTP 403. Likewise if trying to call by just the “appname”, which can only be done from inside the environment. - Incorrectly constructing the FQDN of either external or internal domains
HTTP
HTTP 403 - RBAC: access denied
This is a specific type of HTTP 403 related to IP ingress restrictions in Azure Container Apps. This means the IP of whatever client is requesting this URL is not apart of the allow rules configured for this. This could be either:
- An IP address not falling into a range, if specified
- Or, an IP address that is not apart of a list of specific IPs that is configured.
Recommended actions:
- Review the client addresses requesting the Container App URL and compare this to the rules you have specified.
Note: 403’s that do not return in this manner (eg. RBAC: access denied) are almost very surely to be from the application. In which case, application logs should be reviewed to understand why access is denied for HTTP requests.
HTTP 404 / Not Found
HTTP 404’s are generally due to the resource not existing (ex., the URI is not actually mapped on the application) - but can also happen for a few other reasions:
- The Container App Environment DNS is resolvable but the Container App name is invalid
- Ingress is not enabled
- Ingress is enabled but is not set to external
- The Container App DNS is resolvable but the requested resource on the site is not found / is invalid.
Recomended actions:
- Verify the Container App FQDN is actually correct.
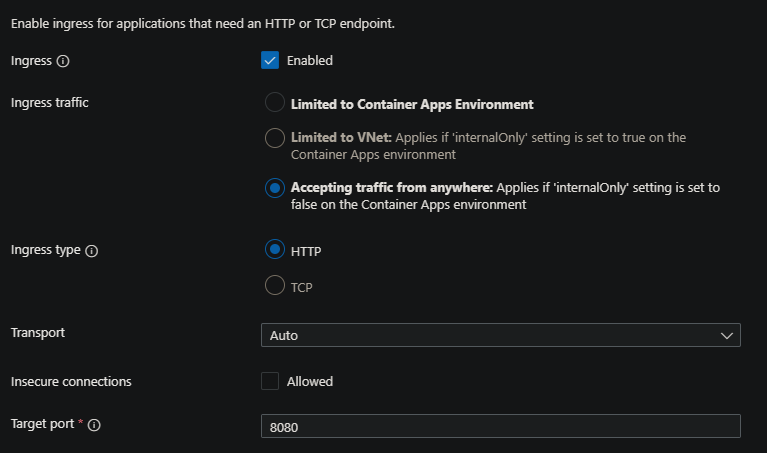
- Verify that ingress is enabled and set to external and Accepting traffic from anywhere - if this is set to internalOnly or with the “Limited to Container Apps Environment” / “Limited to VNet” in the portal, a HTTP 404 may be returned
- This is viewable in the Container Apps portal under the Ingress blade.
- If ingress is set to external traffic outside of the environment - then ensure the resource being requested actually exists with the application.
NOTE: The response of what the 404 looks like (for instance, through a Browser) can help pinpoint the issue here better. If the 404 is clearly returned from the applications web server, this would mean ingress is functioning as intended - if a Chrome/Edge specific 404 is being returned, this may point to a misconfigured ingress set to internal.
HTTP 500’s
These are historically application errors and won’t be covered here - review Observability in Azure Container Apps on how to check your application logging. Application logging must be reviewed.
HTTP 502
This may surface as an error returned from Envoy - upstream connect error or disconnect/reset before headers <some_connection_error /> or stream timeout
Possible cause:
- Timeouts from the application - upstream dependencies timing out on a request
- Application failing to start
Recomended actions:
- Take note of the time out sent back by this request. If it’s returned before 240 (seconds), this is likely an application issue. Envoy’s timeout limit for requests is set to 240 seconds.
- Take note of any dependencies on the routes being invokved - for example, 3rd party API’s, databases, or others.
- Check if the Container is failing to start - there are a few ways to review logging, which would be the next step for this portion - review Observability in Azure Container Apps on how to check this.
HTTP 502’s may be returned in another form of upstream connect error or disconnect/reset before headers. retried and the latest reset reason: protocol error - this is also returned from Envoy and is due to more specific causes.
Possible cause:
- Mismatch protocol versus what’s expected
- Incorrect ingress port
- Application failing to start
- Request timeout
Recomended actions:
- Review what the Ingress port is - this needs to match to the port the application is listening on
- Review the protocol of the requests being made. Trying to make an HTTP/1.1 request while a transport of HTTP/2 is set on the application can cause this
- Likewise, setting the transport to HTTP/2 for a gRPC application but making an HTTP/1.x request will cause this
- If transport is set to “auto” and this is occurring for applications that need HTTP/2 support - like gRPC applications, consider setting the transport to HTTP/2 instead.
- Check if the Container is failing to start - there are a few ways to review logging, which would be the next step for this portion - review Observability in Azure Container Apps on how to check this.
HTTP 503
This typically means the application is crashing or a pod/replicas cannot be created.
Consider using Diagnose and Solve Problems detectors to see if common availability scenarios are being hit as described in Troubleshoot a container app > Errors and failures
Another good resource of confirming if any common availability issues that cause HTTP 503s are occurring is by reviewing Applications (and revisions) stuck in activating state on Azure Container Apps.
HTTP 504
This may manifest as stream timeout from Envoy
Possible cause:
- Most of the reasons in the first half of the HTTP 502 section will apply here.
- Envoy’s request timeout is set to 240 seconds - if requests are not completed by then, the request will be cancelled.
- Upstream dependencies that are not responding or not completing work within the 240 second limit can cause this
Recomended actions:
- Most of the reasons in the first half of the HTTP 502 section will apply here.
Networking specific
Error code: ERR_CONNECTION_TIMED_OUT
This may surface as someapp.funnyname1234.region.azurecontainerapps.io took too long to response
Possible cause:
- Indicates the domain is valid but not reachable. This would apply to scenarios with VNET integration.
Recomended actions:
- Verify that the Network Security Group (NSG) tied to this VNET that is integrated with the Container App Environment is not missing any required Service Tags - this includes the IP of 168.63.129.16 (What is this IP?)
- Review these NSG allow rules here
- Verify that the client subnet or IP address trying to connect is not blocked by NSG rules - this would apply for both VNET and connections incoming from the internet.
- For VNET traffic, the VirtualNetwork Service Tag can be suffient for allowing traffic
- For internet traffic, the Internet Service Tag can potentially be used (although likely not an option for some companies)
ERR_NAME_NOT_RESOLVED
This may surface as someapp.funnyname1234.region.azurecontainerapps.io server IP address could not be found
Possible cause:
- DNS is not resolvable - this can be seen from a client trying to access the Container App from the internet while the application is within a VNET
Recomended actions:
- Verify that the client that is trying to access the application is within a VNET or not.
- If not, or if the VNET is not peered to the existing Container App Environments VNET, connectivity will fail
- For non-networked environments, ensure the complete FQDN is correct and the application still exists
GRPC
Issues with ingress for gRPC applications (using HTTP2) may manifest in different ways - below are a few:
Could not invoke method - Error: Invalid protocol: https
Possible cause:
- Trying to make a gRPC request through a client or tool that’s attempt to make an HTTP/S request
Recomended actions:
- This in itself is not nessecarily an ingress issue with Envoy
- This is due to the fact a gRPC service is trying to be involved with https:// - instead, depending on the tool - leave off the protocol (as it may be inferred) or use either grpc:// or grpcs:// (for secure)
Failed to compute set of methods to expose: server does not support the reflection API
Possible cause:
- The gRPC server (the application) does not support or have reflection enabled
- The Container App ingress is set to internal, but the client is external
Recomended actions:
- Read this article on reflection and how it can affect interaction with your applications here.
- Ensure that ingress is not set to internal only, in which the default FQDN would look like
someapp.internal.funnyname12345a.azurecontainerapps.io. If the client is external (eg., a Browser), and Server reflection is actually enabled - set Ingress to external.
stream timeout
Possible cause:
- The ingress port is not matching what the gRPC server is listening on
- The application is not returning a response within the 240 second time limit (see the HTTP 502 or 504 section)
Recomended actions:
- Review the value for the ingress port and ensure this matches the gRPC server port and what it expects requests to come in on


