General Azure Pipelines and App Service Linux deployment troubleshooting and scenarios
This post will cover common issues and scenarios when deploying to App Service Linux from Azure DevOps pipelines.
Overview
This post aims to cover general and common scenarios that may appear when deploying from self-hosted or Microsoft-hosted Azure Pipeline agents.
A note to remember is a pipeline itself can almost be configured in an infinite number of ways for deployment. This post doesn’t cover user-configurable specific logic.
Investigation and logging
Pipeline logging
⚠ IMPORTANT ⚠: During troubleshooting, always consider reviewing your full pipeline azure-pipelines.yml file. In most cases, pipelines are implemented through yaml files - viewing task/yaml snippets through the classic editor is another approach when using “Classic Pipelines”. See: YAML vs Classic Pipelines - Azure Pipelines | Microsoft Learn.
There are other things that need to be taken into account:
- If the build is failing before any built-in Azure App Service-based deployment task is hit, or a call to Kudu is made for deployment, then this responsibility should be investigated from the pipeline perspective, not App Service. Ensure to follow Review logs to diagnose pipeline issues - Azure Pipelines - Microsoft Learn to view pipeline output, which can help track down what the actual issue is. More often than not this is failing on a task or stage in the pipeline prior to actual deployment
- If the deployment task is failing and/or a call to Kudu for deployment is failing, then still follow the above link in terms logging and understanding the issue. In most cases, the error surfaced back in the deployment task/logic being ran should at least generally point to what the issue is
In short, when starting, always review pipeline logging: Review logs to diagnose pipeline issues - Azure Pipelines - Microsoft Learn. Especially for failures pre-deployment - and during/at the deployment task/logic. If the issue points to elsewhere, you can branch out from there.
App Service Logs
Always ensure App App Service Logs are enabled. This is incredibly important to issues related to “post deployment” issues. As in, the deployment itself was successfull - but you now see application runtime issues. This can be things like plain HTTP 500’s, or something indicating a fatal error or unhandled exception like a HTTP 503.
If these are not enabled, then you’ll have very minimal insight into what’s occurring, if any. When App Service Logs are enabled, these will create files named YYYY_MM_DD_xxxxxxxxxxxx_default_docker.log under /home/LogFiles. stdout/err from your application is written into these files.
You can then view logs from various ways:
- Directly on the Kudu site (yoursite.scm.) - look for
YYYY_MM_DD_xxxxxxxxxxxx_default_docker.log - Logstream - This will tail logging
- FTP - look for YYYY_MM_DD_xxxxxxxxxxxx_default_docker.log
- Azure CLI - This will tail logging
Deployment flow and method of deployment
Since an end-user can technically write a pipeline to use almost anything to actually deploy an artifact to Kudu, that means there will be various deployment methods. Some of this may behave differently, but generally the more common themes are as followed:
-
Builtin deployment tasks like Azure App Service Deploy Task, Azure Web App, etc. (See: [Azure Pipelines task reference Microsoft Learn](https://learn.microsoft.com/en-us/azure/devops/pipelines/tasks/reference/?view=azure-pipelines) use ZipDeploy under the hood. - If a
.waris being deployed to App Service using those above built-in tasks, then this will use WarDeploy. See Deploying WAR based Java applications with CI/CD (GitHub Actions, Azure DevOps) on App Service Linux - If deploying with the Azure CLI by invoking it directly as a command, or, by using the “builtin” AzureCLI tasks, this will use OneDeploy.
- If deploying via a template, such as IaC (Bicep, ARM, Terraform, etc.) this will depend on what your template is doing.
- If
SCM_DO_BUILD_DURING_DEPLOYMENTistrueon the App Service Linux application and is one of the languages here - Supported Runtime Versions for Oryx - then Oryx will build the application. Note, Oryx is a builder, the initial method of deployment will be any of the above still. Java is not supported with Oryx on App Service Linux.
More commonly, App Service built-in tasks are used and ZipDeploy is the main method of deployment.
If you view Kudu “trace” files under /home/LogFiles/kudu/trace, you can see who the “builder” is. However, you can also see this from pipeline logging (see above), which may be easier to look at in some cases. From a kudu logging standpoint, it’ll correspond to this:
- OryxBuilder = Oryx
- OneDeployBuilder = OneDeploy
- BasicBuilder = ZipDeploy (no build automation, this extracts the contents deployed if it’s a zip and copies it to
/home/site/wwwroot)
The typical deployment flow is as follows:
- The request is made from Azure Pipelines to the Kudu side (in terms of a typical deployment, this may not be specific to pipelines only using IaC for setting updates) in the form of a
POSTrequest that deploys an artifact, which is typically a.zip, or in some cases may directly be a.jaror.war - The
.zipis extracted during deployment logic in the Kudu container (.scm. site). Either build automation with Oryx is ran if enabled, or the files are generally copied over towwwrootafter extraction. In both scenarios, with and without Oryx, files are copied towwwroot. - The application container is then restarted
Common scenarios
End of Central Directory record could not be found
When deploying via Azure DevOps to App Service, you may see an error message like the below:
End of Central Directory record could not be found.
##[error]Failed to deploy web package to App Service.
##[warning]Can't find loc string for key: KuduStackTraceURL
##[error]KuduStackTraceURL https://$someapp:***@someapp.scm.azurewebsites.net/api/vfs/LogFiles/kudu/trace
##[error]Error: Package deployment using ZIP Deploy failed. Refer logs for more details.
The reason for this is due to a malformed or incorrect zip file.
Users have a lot of flexibility on how they can create the zip file to be deployed to App Service - built-in Azure DevOps deployment tasks to App Service all expect a properly made .zip.
Some potential reasons for this is:
- Using a builtin Azure DevOps task to package content as a
tarfile instead of a zip - while stil saving the file as a.zip, eg, like the below:
    - task: ArchiveFiles@2
      displayName: 'Archive files'
      inputs:
        rootFolderOrFile: '$(projectRoot)'
        includeRootFolder: false
        archiveType: tar
        archiveFile: $(Build.ArtifactStagingDirectory)/$(Build.BuildId).zip
        replaceExistingArchive: true
- A malformed or corrupt zip file. Review how the zip is being created and through which command/client is being used
Using the builtin ArchiveFiles@2 and setting archiveType to zip is a simple way to ensure app content is zipped properly.
Note, there have been times that using PowerShell to create a Zip Archive is known to cause this. If Powershell is being used, consider using a different alternative to create the zip.
Error: No package found with specified pattern: x\x\x\x***.zip
-
Scenario: Either after the
Buildis transferring the artifact to theDeploystage, or when deploying to the App Service itself in theDeploystage the errorNo package found with specified pattern: x\x\x\x***.zip- Resolution: This is most likely due to a misconfiguration in which the
ArchiveFiles@2orUpload Packagetasks directories are specified. Review the configuration here to see if non-standard paths are being used, such as something other than$(Build.ArtifactStagingDirectory)/$(Build.BuildId).zipbeing used, workingDirectory not set to$(projectRoot), includeRootFolder set totrue, or any combination of these.
- Resolution: This is most likely due to a misconfiguration in which the
Filesystem quota full or disk space full
If the /home storage limit is full, this can affect deployment operations - this may manifest as no space left on device. The stack trace would look something like this from Kudu:
Error occurred type=error text=No space left on device : '/home/site/locks/
This should show in the deployment logging on the Deployment task being used. If the filesystem is still writeable (which is not gaurenteed), you may be able to see this in logging under /home/LogFiles/kudu/trace and/or /home/LogFiles/YYYY_MM_DD_xxxxxxxxxxxx_scm_default_docker.log
| Any additional files will fail to be stored on the mount. Documentation on how much storage is per App Service Plan SKU is described here: [Scale up features and capacities - Azure App Service | Microsoft Learn](https://learn.microsoft.com/en-us/azure/app-service/manage-scale-up#scale-up-your-pricing-tier). Storage quotas for /home per SKU can be found here: Azure App Service limits |
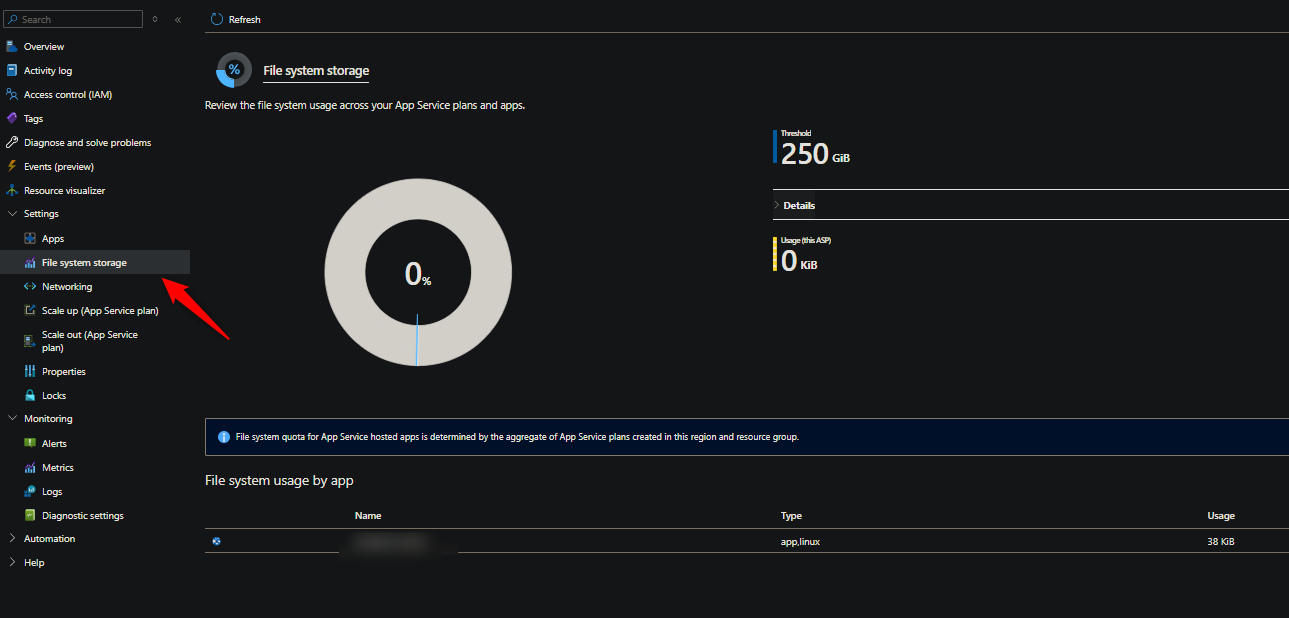
Language agnostic information on storage with App Service can be found here: Azure App Service Limit (1) - Remote Storage (Windows). If wanting to view current usage, go to App Service Plan -> Settings -> File System Storage
“Parking page” is displayed
The “parking page” is the default page when there is either no content deployed or the logic in the “blessed” image chosen cannot find any relevant file/entrypoint to run from the application codebase. This looks like:
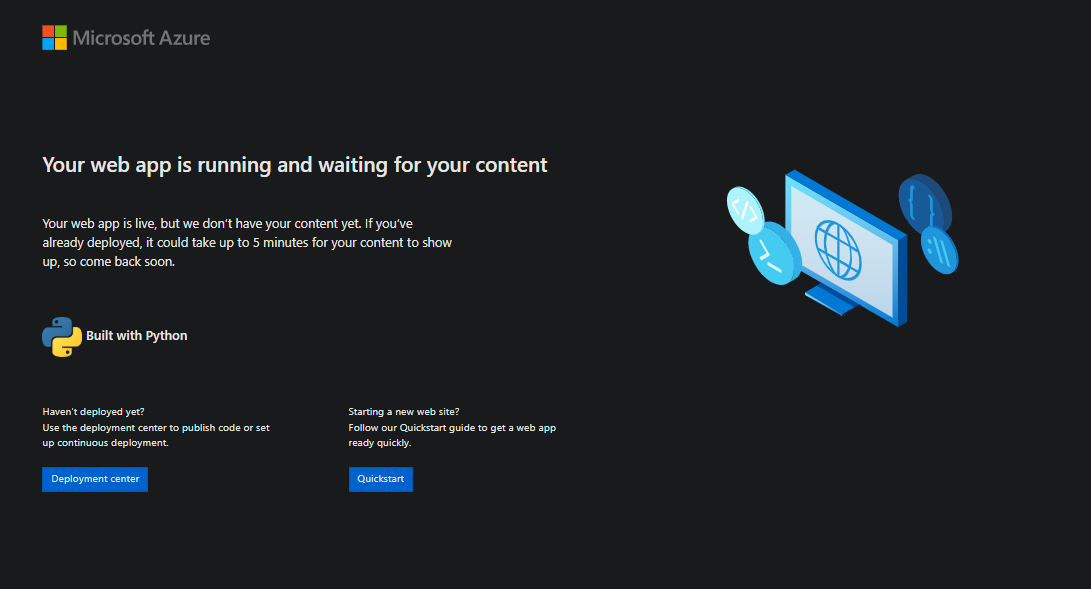
NOTE: Java applications may have slightly different looking pages
The most common reason a one may see this after a deployment, which also may typically show as successful, is they:
- Deploying a nested zip folder. eg., a zip in a zip - and accidentally zipping up the artifact, which is already zipped
- Deploying a nested project structure - which means the “root” of the deployed contents is just a folder, and the actual project contents is nested further. Which means the blessed image entrypoint is unable to find the proper callable/executable
- Files that don’t match what the blessed image expects to run. For example, dotnet containers expects to find a main executable
.dll, Node.js applications expectsindex.js/server.js, etc.
Assuming the deployment is successful - your first step should be to confirm what exactly is under /home/site/wwwroot. If there is a nested zip folder structure, then readdress this from the pipeline perspective. This is likewise for if there is a general nested folder structure - if a user can’t alter this, then change the startup command to target the appropriate entrypoint based on the application and blessed image type.
- Users can confirm whats under
wwwrootthrough various means, such as FTP, Kudu and Kudu /newui, or even the application container via WebSSH. - If the codebase being deployed is for the wrong blessed image type, update the app stack (eg.
linuxFxVersion) to target the proper one.
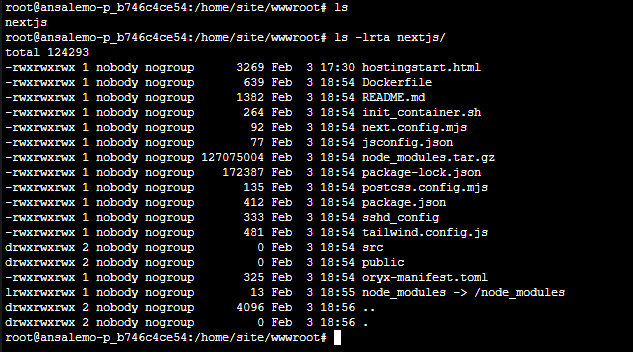
Below is an example of what you may see with a nested project structure that causes the “parking page” to appear - notice the folder that the actual site lives in is nextjs - which is what’s toplevel. The alernative is to add a custom startup command to target the project entrypoint, or (the recommended method), move the site contents to wwwroot outside of said folder:
Nested zips/project structures like the above can also potentially cause a Error: EISDIR: illegal operation on a directory, read during the deployment phase which copies files to wwwroot. When using Oryx, this may contribute to Error: Couldn't detect a version for the platform 'somelanguage' in the repo. For Oryx, ensure the project structure confirms to what Oryx expects, per language, here: Oryx/doc/runtimes at main · microsoft/Oryx
Multiple/concurrent deployment and operation/updates
There have been scenarios where a deployment is initiated from Azure DevOps, but then has additional logic to that may cause the kudu container to restart (certain config updates, scaling operations, etc) - which may be unintentionally during deployment/builder logic on kudu is executing. This can cause a side effect of an incomplete/cancelled deployment
- In most cases, this is redundant/shouldn’t be done. This is for users who are explicitly restarting the app from logic/a task in their pipeline, post-deploy (especially if they’re using “builtin” App Service deployment tasks or the Azure CLI)
- These tasks/the CLI already have logic to request the application to restart. If a user is adding another restart, this is causing a 2x restart
Unless there is very good reason and evidence to do this, avoid doing this.
HTTP 401
This will show in the deployment task on the pipeline side with something like the following (if using the Azure CLI or IaC it may appear slightly different):
        ##[error]Failed to deploy App Service.
        Error: The remote server returned an error: 401 Unauthorized
This is typically going to be related to the following:
- Using a publish profile and the username and/or password is incorrect
- Using an identity, service principal, or service connection (created through ADO) and it does not have proper permissions for deployment. When testing this, ensuring Contributor is set is a good bet.
- Not correctly authenticating with the deployment method used in the pipeline. Since a user can use various methods (eg. IaC, CLI, builtin tasks, etc.) - Consult the deployment methods documentation as needed on how to properly authenticate depending on which deployment method you’re using
HTTP 409 (Conflict)
This will generally look like the following from a Azure DevOps perspective:
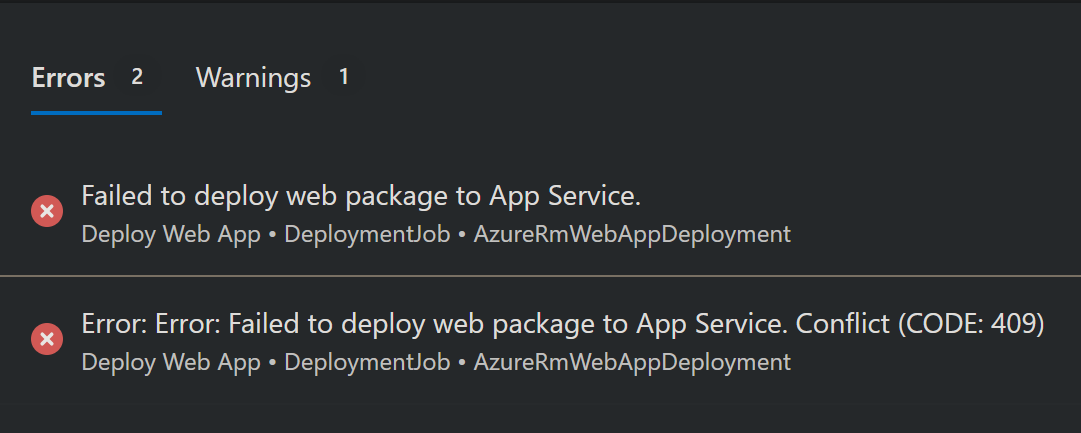
A blog post which goes into detail on this here should be reviewed: Troubleshooting HTTP 409’s when deploying to Azure App Service -. This includes possible reasons why this happens as well as resolutions.
This is especially relevant to Azure DevOps (and CI/CD in general) if deploying parallel deployments to the same App Service at the same time. Kudu does not support concurrent deployments, since a .lock file is created, which helps avoid inconsistent data.
HTTP 503
Kudu is likely exiting/crashing or failing to start. This will show in Azure DevOps tasks as something like the below (it may vary if using alterative deployment methods like Azure CLI/IaC, etc.):
        ##[error]Failed to deploy App Service.
        Error: The remote server returned an error: 503.
Common reasons:
-
High Memory on the instance running that particular Kudu container - which is causing Kudu to fail to start. These out-of-memory errors may surface in
docker.logunder/home/LogFiles, as well- Review Memory Usage, in the Diagnose and Solve Problems blade on your App Service, to confirm Memory usage on instances used to host the application. Use Linux Memory Drill Down, to see if any particular site processes are consuming more memory than others. If this is due to a saturated App Service Plan, split the plan into a more manageable size. As a possible interim, scale up if possible for more memory on the machine.
- BYOS - Bring Your Own Storage failing to mount. When this happens, this will also affect the Kudu container - so deployments will fail. See How to troubleshooting Bring Your Own Storage (BYOS) issues on App Service Linux
- In more rare cases, issues with networking - such as subnet address space exhaustion will cause this.
Insights into these other issues, regarding BYOS and other start failures, may be surfaced in Web App Troubleshooter detector via Diagnose and Solve Problems
Kudusync - file not found (ENOENT)
kudusync is a node.js written application - when it encounters an issue during file sync to /home/site/wwwroot - it will return:
Error: ENOENT: no such file or directory, stat '/home/site/wwwroot/somefile'
This error will be found in:
- The Azure DevOps pipeline deployment task logging
- Kudu log files under
/home/LogFiles/kudu
This error is not only for Node.js applications - only the Kudusync tool is written with node.js, this can occur for any application that is using ZipDeploy. This error may happen for different reasons:
- Check if file in the
ENOENTerror is always the same file. If so, does it actually exist in the deployment zip?- Does it exist in wwwroot?
- If it doesn’t exist in the zip, then ensure it’s included in subsequent deployments and try again
- Symlinks. Does the file in question have symlinks to other files? For node applications in particular, this may be deduced by the file being under the
.bindirectory (see: NPM executables not being found on App Service Linux -) - which in turn means the file was installed “globally” through a npm/yarn package manager. Reinstall the package without global (-g) installation into their project locally.- You may need to delete
node_modulesunderwwwrootand then redeploy, if the above doesn’t resolve this.
- You may need to delete
- Is
wwwrootusing aread-onlystorage volume? This can be tested by simply trying to create a file underwwwroot - Is there any resource contention, specifically high CPU? - The CPU Usage detector in Diagnose and Solve Problems can be used for this
If the file in question does exist, and there is no symlinks, and the volume is not read-only without resource contention, then try the following mitigations:
- Stop/start the site. Then redeploy
- If that doesn’t work, then scale - wait until it’s confirmed a new instance is running the kudu container - and then redeploy
- Or, delete the contents of
wwwroot, and redeploy. It is much more advisable to test this on a staging slot instead - You can alternatively try to enable Oryx with
SCM_DO_BUILD_DEPLOYMENT=trueand redeploy, provided the application follows Oryx’s expected project structure to build the application.
Long deployment times
Long deployment times (tens of minutes, or more) can happen if there is a very large amount of site content being deploy - and/or - if CPU is high during deployment time (eg. 80%+)
Node applications experience this more often than other stacks due to the size of node_modules. The default timeout is 40 minutes - which should be more than enough for most sites, but if really needed, users can extend this out with the App Setting SCM_DEPLOYMENT_TIMEOUT_MINS. However, if they’re hitting a timeout after 40 minutes, this is more of a bandaid than an actual fix.
- Validate if high CPU is present during deployment time. If so, scale up to a higher SKU. Sometimes users can do this temporarily and then scale back down if cost is a concern - but note this will cause restarts of the sites on the App Service Plan. If a user also happens to have a lot of sites on the plan, then scaling up/down should be avoided incase is creates other issues. Consider splitting the plan and scaling up to a larger SKU
- If there is a lot of site contents, especially with Node applications - review best practices as called in the links below in Runtime stacks -> Node.js
- For Single Page Applications (SPAs), like React/Angular/Vue - a user should just only deploy the production build static contents. This will significantly reduce deploy time and payload size. Ways on how to do this from Azure DevOps are described in the below links. The below blogs discuss this in the Deployments to Kudu timing out, or taking an extended amount of time, due to number of files section of the blog:
- For sites that happen to use a SPA frontend with a server-side backend, the above practice can also be done for these types of applications. Note that this kind of configuration/rework of build logic is 100% going to be done, and should be done, on the pipeline side
- Users deploying to smaller SKU’s (free, basic, standard). Considering the lack core count and downgraded/lower tier virtualized hardware - this will likely manifest as the above point about “high CPU”. Scale up to a higher SKU.
Network environments
For App Service’s with Access Restrictions or using Private Endpoints, this is typically going to surface as a HTTP 403 in deployment task logging
From a pipeline logs perspective in the deployment task/logic, it’ll look something like this:
    ##[error]Failed to deploy App Service.
    Error: The remote server returned an error: (403) Forbidden.
This may also manifest as DNS resolution errors such as no such host / no host found, or connection errors if inbound connections are blocked via NSG, such as connection refused, connection reset by peer or connection timeout.
Users using custom methods like the Azure CLI via their own script in the pipeline or through the builtin task may see something like the below if inbound traffic is blocked:
HTTPSConnectionPool(host='somesite.scm.azurewebsite
s.net', port=443): Max retries exceeded with url
Considerations:
- If the application is hosted in an ASE, or has an App Service with a Private Endpoint - you’ll need to use Self hosted agents. This is so you can deploy these to VM’s, and have these VM’s be deployed as part of the VNET/subnet for allowed access to the ASE/Private Endpoint enabled sites. This way they can use different options for a solution such as:
- Same VNET as App Service
- Another VNET peered to App Service VNET
- NSG’s and ServiceTags
-
Otherwise, [Microsoft-hosted agents for Azure Pipelines - Azure Pipelines Microsoft Learn](https://learn.microsoft.com/en-us/azure/devops/pipelines/agents/hosted?view=azure-devops&tabs=yaml#networking) are the defaults, which are by default public enabled and cannot be added into a VNET. The closest that can be done is allowing certain IP ranges - however, these will change over time - and most organizations will not allow this and why self-hosted agents should be done.
Users who want to actively troubleshoot being able to reach Kudu/App Service from a pipeline can do so more easily on a self-hosted machine. Once they’re on the machine (eg. via SSH) - they can install or use typical troubleshooting tools like nc, tcpping, to test general connectivity - and use dig and nslookup to test proper name resolution
- If using Microsoft hosted pipelines, you can only do this by writing a task (eg. through
script) and invoking these commands and looking at the output, per run. This is not very efficient and may cause more troubleshooting time
A walkthrough with Azure DevOps and self-hosted agents and deploying to App Service (Linux) can be found here: Deploying to Network-secured sites - Azure App Service
Application errors, post-deployment
This specifically refers to the fact the deployment was successful from a Kudu standpoint - but the application is failing to start (or crashing right after starting), after a deployment was done.
It is best to treat these issues initially as a application runtime error, so ensure the following is done:
- Ensure App Service Logs are enabled and review
default_docker.log/docker.logfiles - After reviewing error logs, see if this points in a particular direction. For example
- Is there errors about missing packages/dependencies?
- Is there a connectivity/name resolution/networking issue?
- Is there general errors about configuration errors? Or the application failing to start and timing out?
- Is there any high CPU or memory after deployment? If so, validate if this is caused by the application process via Diagnose and Solve Problems, the Metrics blade, or other data such as any integrated APM’s
- etc.
For specific guidance based on the errors found after step 2, look at the blog links and the Runtime Stacks section below in this post.
If error logs points to any of these issues, review the below links as an “app down” issue - as well as Troubleshooting Container didnt respond to HTTP pings on port, failing site start. More specific language-based troubleshooting can be found in relevant blog sections under the respective language areas:
- Java Blog: Java -
- Node - Blog: Nodejs -
- PHP - Blog: PHP -
- Python - Blog: Python -
- Dotnet - Blog: .NET -
It is best to review if the error in question relies on any logic in the pipeline. For example, if the application is not building with Oryx - then the zip package is expected to have all relevant site contents needed to run the application, as is. If any part of the pipeline is not including certain files, or not setting certain configurations that the application requires, either in the build pipeline - or on the App Service itself - then this needs to be addressed and be looked into.
Environment variables
Users can set environment variables in different places, which will have different effects.
- In the pipeline, for the pipeline only (eg. build logic, agent logic, etc.)
- On the pipeline, in their deployment task, to be used at runtime on App Service
If you want to set environment variables for the pipeline, for example, variables to be used during the build process for their app, look at Define variables - Azure Pipelines | Microsoft Learn. A scenario where this may bubble up to the App Service perspective, is if a user expects an environment variable to exist/be injected for the build logic, but is actually missing - however when the application is ran at runtime, it fails, and may manifest as an application crashing or various runtime errors.
- If there is an error and you suspect this may be relevant - eg., the application is crashing or has other runtime errors - review those from the App Service perspective via App Service Logs. And then review the App Service Logs / Pipeline logging section above.
- Another somewhat common real-world example is with Single Page Applications (or SPA’s being used for frontends with backend apps) and environment variables. SPA’s that are building their production bundle/build expect environment variables to exist in the environment at build time. If a user is doing the build on the pipeline, and deploying with something like ZipDeploy (without Oryx), then these variables need to exist on the pipeline, at a minimum. See Missing or undefined environment variables with Node on App Service Linux - for more specific information on this.
Users who want to set variables for App Service (at runtime), need to set this through their pipeline, which can be done in various ways:
-
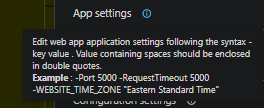
through built-in tasks, if using the Task Assistant in the portal, they can add in App Settings through this way with the sytnax of
-SOME_ENV_VAR "somevalue", such as below: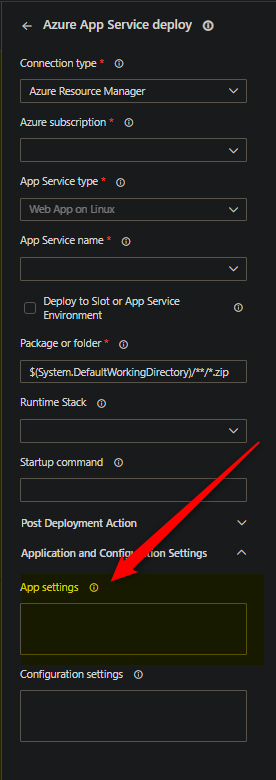
-
The
.yamlequivalent would be the below. Note, not all tasks may allow this, Azure App Service Deploy/Azure Web App are two that follow this - others like “Azure CLI” builtin tasks will be different:
          - task: AzureWebApp@1
            displayName: 'Azure Web App Deploy: '
            inputs:
              azureSubscription: $(azureSubscription)
              appType: webAppLinux
              appName: $(webAppName)
              AppSettings: 'FOO=bar'
- If using more “custom methods” such as manually invoking the Azure CLI or IaC will need to use whatever methods/options are exposed to update/add App Settings for the respective App Service through those clients.
Since in these cases App Settings are applied to the App Service, you can view environment variables on the App Service by going to the Azure Portal -> Configuration -> Environment Variables
If there is any post-deployment application errors, ensure to review App Service Logs. Look for any errors that may be related to specific environment variable key/values or things like connection strings. See the Application errors, post-deployment section above.
Missing packages/dependencies
This can happen for any languages, but is more common to: Node, Python, and PHP.
The common scenario for this is a user doing a “typical” deployment from Azure Pipelines, where the artifact is a Zip - and therefor using BasicBuilder. Since this is “zip deploy”, the zip is expected to have all files expected by the application. Notably node_modules for node, A virtual environment and all packages in site-packages in the virtual env for Python, and vendor/ for PHP.
When this happens, the deployment is typically missing this dependency folder (although this can happen for specific packages too). Add the relevant build step for the application language in the pipeline, and ensure all dependencies are packaged in the zip. If this isn’t an option, the only other choice is to enable Oryx and let Oryx build it. Ensure the project structure matches what Oryx expects: Oryx/doc/runtimes at main · microsoft/Oryx
Confirm what is in the zip/artifact by downloading it from the pipeline. This is also helpful in scenarios where you want to prove if dependencies are in the zip, or if it’s limited to some occurring issue during the build/pipeline specific portion.
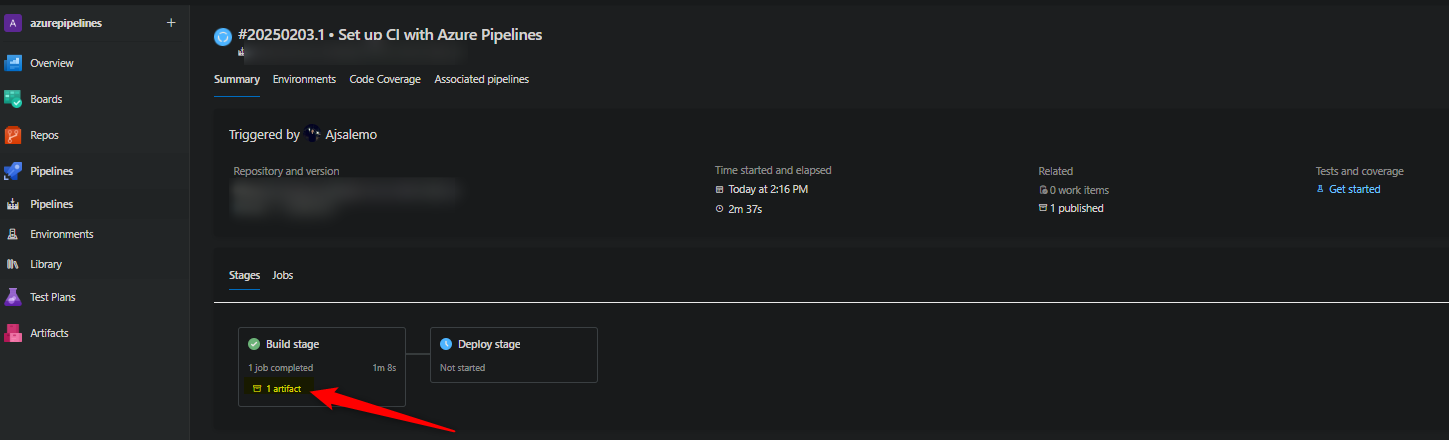
- Artifacts product during a stage will show as
n artifact. Typically this is/should be just one (1). This is a hyperlink, click on it to go to the below page:
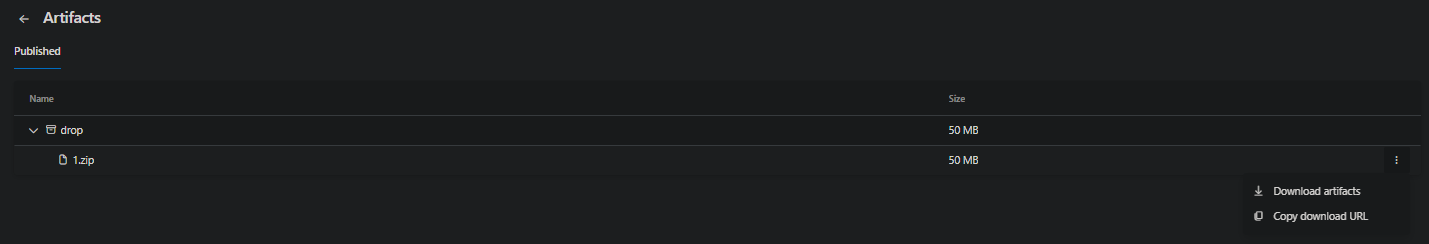
- Select the zip artifact to download it. You can then use this as an approach to confirm if a specific file/dependency/etc. is in the artifact at this point of the stage.
- If you also notice many nested folders above the zip, this may also create the problem described in the “Parking page” is displayed section above.
For stack/language specific assistance with missing modules/packages/dependencies and ensuring these are properly deployed, consult the relevant blog posts under the Runtime stacks section below
Custom startup scripts/commands
Applications like PHP and Python (and others) may need to rely on specific non-standard startup commands/scripts to start the application. You can set a command directly from the pipeline with “builtin” tasks like AzureWebApp and AzureRmWebAppDeployment. Examples are below:
// AzureWebApp@1 uses `startUpCommand`

          - task: AzureWebApp@1
            displayName: 'Azure Web App Deploy: somesite'
            inputs:
              azureSubscription: $(azureSubscription)
              appType: webAppLinux
              appName: $(webAppName)
              runtimeStack: 'NODE|20LTS'
              package: $(Pipeline.Workspace)/drop/$(Build.BuildId).zip
              startUpCommand: 'pm2 start server.js --no-daemon'
// AzureRmWebAppDeployment@1 uses `StartupCommand`

          - task: AzureRmWebAppDeployment@4
            inputs:
              ConnectionType: 'AzureRM'
              azureSubscription: 'somesub (00000000-0000-0000-0000-000000000000)'
              appType: 'webAppLinux'
              WebAppName: 'somesip'
              packageForLinux: '$(System.DefaultWorkingDirectory)/**/*.zip'
              RuntimeStack: 'PYTHON|3.11'
              StartupCommand: 'gunicorn --worker-class uvicorn.workers.UvicornWorker --bind 0.0.0.0:8000 -w 4 --timeout 600 --access-logfile ''-'' --error-logfile ''-'' app:app''
If you wanted to use a custom startup script (not an inline command like above), make sure this is deployed in your artifact, and then target the command wherever it exists under wwwroot, eg:
// AzureWebApp@1 uses `startUpCommand`

          - task: AzureWebApp@1
            displayName: 'Azure Web App Deploy: somesite'
            inputs:
              ...
              runtimeStack: 'PHP|8.3'
              package: $(Pipeline.Workspace)/drop/$(Build.BuildId).zip
              startUpCommand: '/home/site/wwwroot/startup.sh'
// AzureRmWebAppDeployment@1 uses `StartupCommand`

          - task: AzureRmWebAppDeployment@4
            inputs:
              ...
              RuntimeStack: 'PHP|8.3'
              StartupCommand: '/home/site/wwwroot/startup.sh'
Users can also use inline Azure CLI commands (or the builtin task), IaC (Bicep/Terraform/ARM, etc.), or others, in their deployment task/release, to set startup commands.
When setting custom startup commands/scripts - you can check to see if this was set after the deployment, on the App Service side, by going to the Azure Portal -> Configuration -> Startup Command
Oryx issues
For issues specific to Oryx usage when deploying an artifact from Azure Pipelines, in general, or stack/language specific with Oryx, see the following areas:
- Blog: Troubleshooting Node.js deployments on App Service Linux -
- Blog: PHP Deployments: Troubleshooting PHP deployments on App Service Linux with Oryx -
- Blog: Troubleshooting Python deployments on App Service Linux -
NOTE: Java doesn’t use Oryx. Ruby and Go images are deprecated/removed.
Runtime stacks
The below links go to specific language categories on this blog. There are various topics for “application issues post deployment” related scenarios, as well as deployment specific.
Some of the above scenarios may reference this section for more language specific issues:


