Basic Network Troubleshooting in Linux
This blog covers basic Linux network troubleshooting with core open source tools and a handy automated troubleshooting script.
Readme: https://github.com/azureossd/networking-troubleshooting-utility/blob/main/README.md
Overview
Outbound connectivity issues in cloud environments can stem from many causes and manifest in different ways. Applications may experience intermittent or persistent failures when reaching a specific host or API. Sometimes only one external endpoint is affected while others remain accessible, and in other cases all outbound traffic fails.
Common causes include DNS resolution errors, routing or firewall misconfigurations, upstream service failures, and platform constraints such as SNAT port limits in Azure App Services. These problems typically appear as latency, timeouts, or refused connections, often surfacing as HTTP 5xx errors downstream or at the client.
Effective troubleshooting requires isolating the failure domain, whether DNS, network path, platform limits, or application behavior. The following tools and approaches can help systematically diagnose and resolve these issues.
Environment Setup and Prerequisites
Before troubleshooting, confirm which tools are available. Managed runtimes (Azure App Services, Conatainer Apps etc) or IaaS services (ex:Azure VMs) may not include all utilities by default.
In Azure App Service (Kudu SSH console): curl, dig, nc, and tcpdump are pre-installed in the sandbox. nmap, tshark, and zeek are absent and must be side-loaded as static binaries into /home (persistent storage) if needed. Note that as a non-root user, you cannot install these tools in the kudu container. Additionally, to be able to install these tools in the runtime container, it needs to be up and running. And with custom docker containers on App Services, ssh would need to be enabled. Refer here for steps to enable SSH.
Below can be run as a quick test to see which (common) tools are already installed.
# Inventory what is available
for tool in curl wget dig nslookup nc nmap tcpdump tshark zeek ss netstat ip traceroute mtr iftop tcpping; do
    command -v "$tool" &>/dev/null && echo "✓  $tool" || echo "✗  $tool (not found)"
done
DNS
One of the first steps in troubleshooting upstream connectivity failures is validating name resolution. In Linux based environments, it is important to review /etc/hosts and /etc/resolv.conf, as these files may contain custom entries. Always validate DNS before moving to reachability tests.
When an application, command line tool such as curl, browser, or runtime attempts to resolve a hostname, it invokes the operating system resolver through a system call. Typically (as determined by the resolutin order), /etc/hosts is checked first followed by DNS servers defined in /etc/resolv.conf. When any process resolves a hostname the OS resolver follows an order controlled by /etc/nsswitch.conf — typically files first, then dns:
A couple of tools(nslookup and dig) and their example usage is below.
dig
Basic resolution:
dig microsoft.com
Query a specific DNS server (bypass the system resolver):
dig @8.8.8.8        microsoft.com   # Google public DNS
dig @168.63.129.16  microsoft.com   # Azure platform resolver
dig @10.1.0.4       microsoft.com   # An example custom DNS server in your VNet
Follow the full delegation chain:
dig +trace microsoft.com
Reverse DNS lookup:
dig -x 20.112.52.29
Query specific record types:
dig microsoft.com A       # IPv4
dig microsoft.com CNAME   # Canonical name alias
dig microsoft.com TXT     # SPF, DMARC, ACME challenges
dig microsoft.com NS      # Authoritative nameservers
dig microsoft.com SOA     # Start of Authority
Measure DNS query time and check TTL:
dig microsoft.com | grep -E "Query time|ANSWER SECTION|IN\s+A"
# ;; Query time: 4 msec
# microsoft.com.  30  IN  A  20.112.52.29
A low TTL (30 seconds in this case) means results expire quickly. A cached NXDOMAIN with a TTL of 300 will persist for 5 minutes even after a DNS fix is deployed. Account for this when validating a fix.
nslookup
nslookup microsoft.com
nslookup microsoft.com 168.63.129.16   # query a specific server
TCP Reachability and Connectivity Testing
If DNS resolution fails, review /etc/resolv.conf, test with an alternate DNS server, and confirm there are no local blockers such as an incorrect hosts file entry or a corporate proxy interfering with name resolution. Check custom DNS servers, forwarding, and Firewall rules.
Once name resolution succeeds, the next step is to validate reachability. These tests determine whether traffic can physically traverse the network path to the destination over TCP.
While several tools are available for this purpose, utilities such as nmap and nc are commonly present in Linux environments and offer many useful capabilities including port scanning, custom packet testing, and basic data transfer.
Basic TCP connectivity test:
nc
nc -zv -w 5 microsoft.com 443
Probe multiple ports in a single command:
nc -zv microsoft.com 80 443 8080
Send a raw HTTP request and inspect the response
printf "GET / HTTP/1.0\r\nHost: microsoft.com\r\n\r\n" | nc microsoft.com 80
nmap Port and Service Discovery
nmap provides richer results than nc, including service identification and the distinction between a filtered (firewall dropped) port and a closed (RST received or unavailable) port.
Single port test:
nmap -p 443 80 microsoft.com
TCP SYN scan:
nmap -sS -p 80,443 microsoft.com
Service and version detection: Very handy
nmap -sV -p 443 microsoft.com
# 443/tcp open  ssl/http Microsoft IIS httpd
Show why each port has a given state (filtered vs. closed): Equally, very useful
nmap -p 443 --reason microsoft.com
# 443/tcp open      syn-ack    — port open, accepting connections
# 443/tcp filtered  no-response — firewall/NSG silently dropping packets
# 443/tcp closed    reset       — host reachable, nothing listening on that port
curl
curl is a useful tool for end-to-end n/w validation as well as for downloading packages or artifacts.
Simple request with granular timing breakdown:
curl -o /dev/null -s -w \
"DNS lookup:    %{time_namelookup}s\n\
TCP connect:   %{time_connect}s\n\
TLS handshake: %{time_appconnect}s\n\
TTFB:          %{time_starttransfer}s\n\
Total:         %{time_total}s\n\
HTTP status:   %{http_code}\n" \
https://microsoft.com
Very verbose — includes the full TLS certificate chain:
curl -vvv https://microsoft.com 2>&1 | head -100
Test with internal or custom CA certificate
curl --cacert /etc/ssl/certs/custom-ca.crt \
  https://custom-api.mycompany.com
ss or netstat. Note that ss is a newer replacement.
# Show aoo connections
netstat -tunp
# Connections to a specific remote host
ss -tnp dst microsoft.com
# Show details including MTU and MSS for active connections
ss -tin
Check Interface MTU
# Show all interfaces and their MTU
ip link show
# Single interface
ip link show eth0 | grep mtu
Other utilities
Additional tools are available to quickly troubleshoot connectivity, review bandwidth usage, latency, and overall network performance. Common examples include iftop, iptraf-ng, and nethogs, all of which provide real time visibility into network activity on Linux systems.
After installation, these utilities can be launched directly from the console to display active connections in real time.
iftop
Iftop also launches a UI which shows live traffic and can be useful to view current and active outbound connections and bandwidth usage.
iftop -i eth0             # live bandwidth by connection pair
iftop -i eth0 -f "port 443"   # filter to HTTPS only
nethogs
nethogs eth0              # bandwidth by PID
nethogs -d 2 eth0         # refresh every 2 seconds
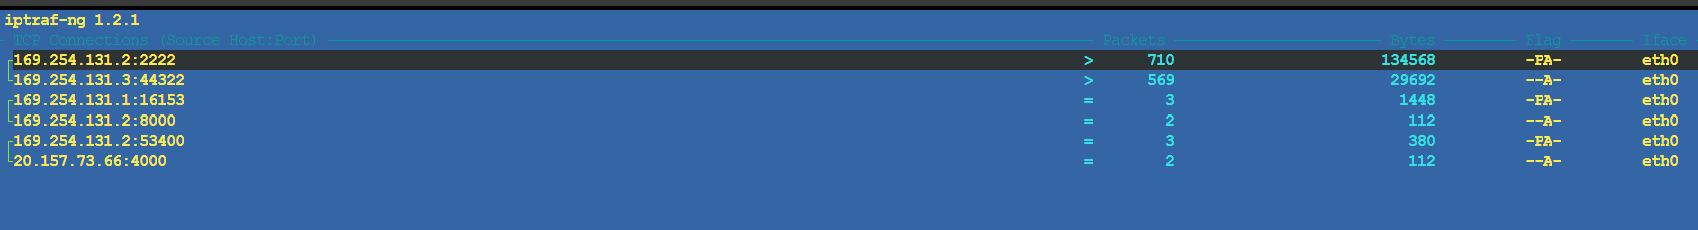
iptraf-ng UI based tool similar to iftop nad nethogs with additional utility
Example view below showing outbound connections
Capturing Network traces
If reachability or connectivity tests fail, or if the issues are intermittent, capturing and analyzing a network trace is the next step. tcpdump is a powerful tool for this purpose, allowing you to record traffic that can be analyzed directly in the CLI using tcpdump or tshark, or externally with tools like Wireshark.
Full Capture with tcdump
tcpdump -i any -s 0 -tttt -U -nn -w “trace.pcap”
This command captures full TCP packets (-s 0) on all interfaces (-i any), includes timestamps (-tttt), avoids resolving hostnames and ports (-nn), outputs in verbose mode (-vv) (not needed), and writes packets immediately to disk (-U) to the specified file (-w).
Filters can be applied during capture, often to reduce noise. However, it may be beneficial to capture all traffic on primary (or all) interfaces and apply filters later during analysis.
# Rolling capture with 100 MB file rotation, keeping 5 files
tcpdump -i any -s 0 -nn -w trace_%Y%m%d_%H%M%S.pcap -C 100 -W 5

# Traffic to or from a specific host
tcpdump -i any -s 0 -nn -w trace.pcap host microsoft.com

# Traffic on a specific port
tcpdump -i any -s 0 -nn -w trace.pcap port 443

# Traffic between two specific IP addresses
tcpdump -i any -s 0 -nn -w trace.pcap \
  'src host 10.1.0.10 and dst host 20.112.52.29'

# TCP RST and FIN packets only (connection termination events)
tcpdump -i any -nn -s 0 -w resets.pcap \
  'tcp[tcpflags] & (tcp-rst|tcp-fin) != 0'

# DNS traffic only
tcpdump -i any -s 0 -nn -w dns.pcap port 53
Analyzing network trace
The packet capture file can be analyzed in several ways right away with tcpdump or tshark.
With tcpdump
# Verbose output
tcpdump -v -r trace.pcap

# Show ASCII payload (useful for HTTP headers and plain-text protocols)
tcpdump -v -A -r trace.pcap

# Filter to traffic involving microsoft.com's IP
tcpdump -nn -r trace.pcap 'host 20.112.52.29 and port 443'

# Show DNS queries and responses
tcpdump -A -nn -r trace.pcap 'port 53'

# All unique destination ports contacted (from SYN packets)
tcpdump -nn -r "trace.pcap" \
  'tcp[tcpflags] & tcp-syn != 0 and tcp[tcpflags] & tcp-ack == 0' | \
  grep -oP '\d+\.\d+\.\d+\.\d+\.(\d+)' | \
  grep -oP '\d+$' | sort -n | uniq -c | sort -rn
Deeper Analysis with tshark
tshark provides a more powerful command-line option for analyzing capture files. A practical approach is to take a quick trace while troubleshooting an issue live and analyze it immediately with tcpdump or tshark. If the results are inconclusive, the capture file can be examined externally using tools such as Wireshark. For more complex scenarios, a comprehensive, long running (with file rotation) network trace can be captured to provide deeper insights.
# With absolute UTC timestamps
tshark -r trace.pcap -t ud
# All DNS records
tshark -r trace.pcap -Y "dns"
# TCP RST packets
tshark -r trace.pcap -Y "tcp.flags.reset == 1"
# TCP retransmissions (tshark expert analysis field — reliable)
tshark -r trace.pcap -Y "tcp.analysis.retransmission"
# IP endpoint statistics (top talkers by packet and byte count)
tshark -r trace.pcap -q -z endpoints,ip
In real-world environments, it is common to iterate through multiple analysis methods to isolate the issue. To simplify this process, below is a handy OSS script that wraps these native Linux tools into a single interface. It can be downloaded with a simple curl command and run either interactively or by specifying the destination IP and/or port.
Usage
Download and install the script with the below curl command
curl -fsSL https://raw.githubusercontent.com/azureossd/networking-troubleshooting-utility/refs/heads/main/nwutils_install.sh | bash
Install all tools (only) and run the commands manually
nwutils install
Run interactively for dynamic ports
nwutils run
Or pass the target directly
nwutils myapi.com 4000
Simply run the script and it installs the necessary tools, runs through the diagnostics, collects network trace (default 60s), analysis the trace and generates a logfile and a html report with a summary.