Collecting Memory Dumps with dotnet-monitor Using a Sidecar
Overview
Collecting a memory dump from a .NET app usually requires running a diagnostic tool, such as dotnet-dump, in the same environment as the target process. With a custom container, this often means adding the tool to the application image and arranging a way to invoke it. Typical production images are intentionally minimal and may not include either the tool or an SSH server.
The dotnet-monitor container image provides another approach. It runs as a sidecar and can collect dumps, traces, logs, and metrics from a running .NET process in a separate container. By deploying the image as an App Service sidecar, the diagnostic tooling remains separate from the application image and can be updated or removed independently.
How the dotnet-monitor Sidecar Works
dotnet-monitor communicates with the app’s .NET runtime over a diagnostic port implemented as a Unix domain socket. The app container and the dotnet-monitor sidecar mount the same volume (for example, /diag) so that both can access the socket.
Collection rules define the condition to monitor and the diagnostic artifact to collect. When a rule’s condition is met, dotnet-monitor runs its configured actions.
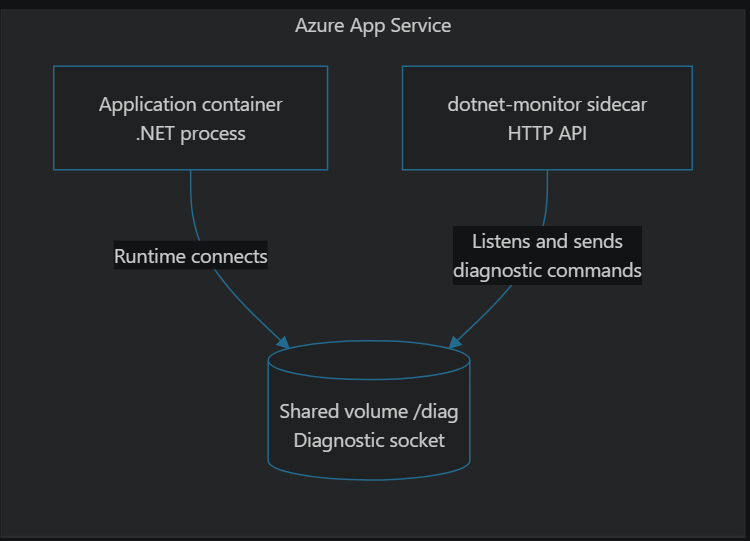
The collection flow is:
- The .NET runtime starts and connects to the diagnostic socket in the shared directory.
- When triggered,
dotnet-monitorsends the collection command to the runtime through the diagnostic socket. - The runtime writes the dump to a location that both containers can access.
dotnet-monitorreads the dump and sends it to the configured destination.
Setup
0. Sidecar Image and Port
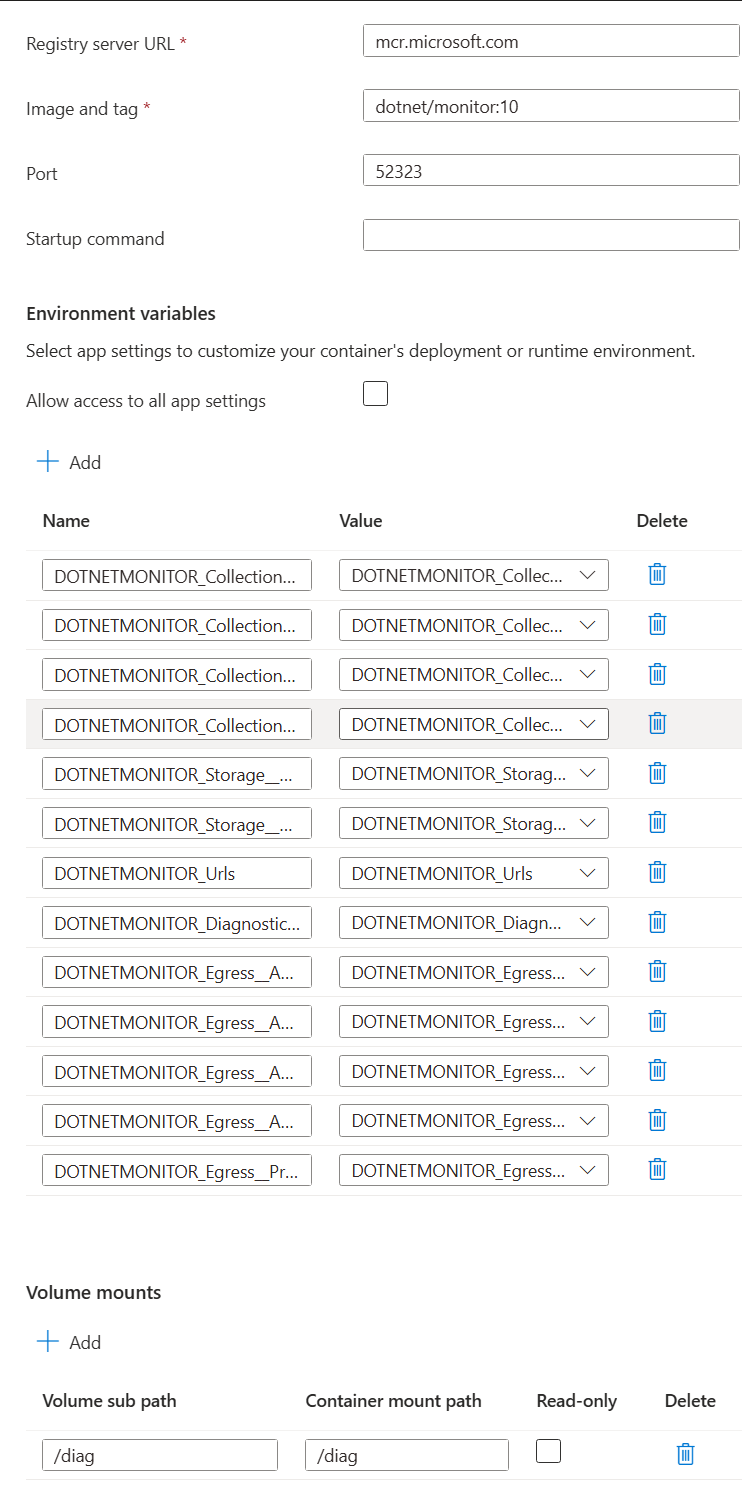
This example uses the mcr.microsoft.com/dotnet/monitor:10 image. dotnet-monitor listens on port 52323. In Deployment Center, select Add > Custom container, and configure the image and port.
1. dotnet-monitor Baseline Setup
For the baseline setup, you will need the following Environment Variables. These should be applied to the site-wide Environment Variables, not the container specific ones. This will configure the app to send diagnostic data to /diag/dotnet-monitor.sock, and configure dotnet-monitor in the Listen mode.
DOTNET_DiagnosticPorts: /diag/dotnet-monitor.sock,nosuspend
DOTNETMONITOR_Urls: http://localhost:52323
DOTNETMONITOR_DiagnosticPort__ConnectionMode: Listen
DOTNETMONITOR_Storage__DefaultSharedPath: /diag

# This assumes the shared volume is mounted to /diag on both containers.
For a more detailed explanation of each setting, refer to the repo docs. The docs target Kubernetes, but the same principles apply to our App Service sidecar scenario: Running in Kubernetes
2. Adding a Volume Mount
Mount a shared volume at /diag in both the app and sidecar containers. Configure the mount by navigating to Deployment Center and selecting each container in turn.
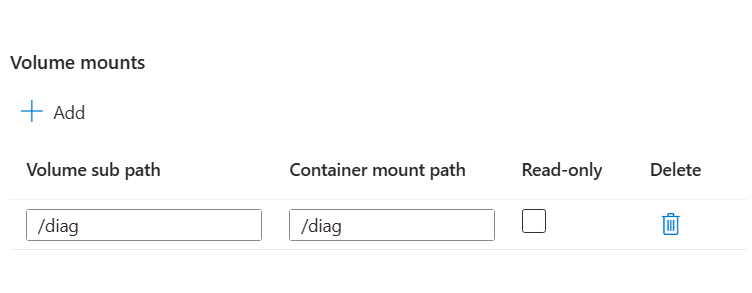
3. Collection Rule Setup
Next, configure a collection rule. This example captures a memory dump when the GC heap size reaches 500 MB.
DOTNETMONITOR_CollectionRules__HighMem__Trigger__Type: "GCHeapSize"
DOTNETMONITOR_CollectionRules__HighMem__Trigger__Settings__GreaterThan: "500"
DOTNETMONITOR_CollectionRules__HighMem__Actions__0__Type: "CollectDump"
DOTNETMONITOR_CollectionRules__HighMem__Actions__0__Name: "MemoryDump"
DOTNETMONITOR_CollectionRules__HighMem__Actions__0__Settings__Egress: "monitorBlob"
This is highly customizable. Different triggers can be used, and different diagnostic data can be collected. You can refer to the following to see other options that are available: Collection Rule Examples
4. Memory Dump Temporary Storage Setup
When memory dumps are collected, dotnet-monitor signals to the app container to start the capture. The capture itself will be done within the app container. For that reason, we need a shared storage between the app and sidecar so that the captured dump is visible to dotnet-monitor.
Since we have DOTNETMONITOR_Storage__DefaultSharedPath: /diag this will be the default temporary output. However, if dump size is large, there may not be enough space to store the file under /diag. If a large dump is anticipated, we should direct the temporary storage to a path with more capacity. There are 2 main options for this.
a. Enable the App Service built-in persistent storage
Set the WEBSITES_ENABLE_APP_SERVICE_STORAGE environment variable to true to enable persistent storage at /home. The content is shared by the app’s containers and scaled-out instances. Be mindful of the storage quota for the App Service plan.
b. Mount an Azure Files Share
Another option is to mount an Azure Files share. Use a mount path distinct from /diag. In the Azure portal, navigate to Settings > Configuration > Path mappings > New Azure Storage Mount.
In this example, we’ll mount an Azure Files share to /dumps. After the share is mounted, configure the temporary output directory as follows. If you opt for (a), then designate a location under /home.
DOTNETMONITOR_Storage__DumpTempFolder: "/dumps"
5. Dump Destination Setup
Now that we have our temporary output directory set up, we’ll need to configure our final output destination. There are several options for this as well, but in this example, we’ll output to an Azure blob storage.
DOTNETMONITOR_Egress__AzureBlobStorage__monitorBlob__accountUri: "https://<storage name>.blob.core.windows.net"
DOTNETMONITOR_Egress__AzureBlobStorage__monitorBlob__containerName: "<container name>"
DOTNETMONITOR_Egress__AzureBlobStorage__monitorBlob__blobPrefix: "artifacts"
DOTNETMONITOR_Egress__AzureBlobStorage__monitorBlob__accountKeyName: "MonitorBlobAccountKey"
DOTNETMONITOR_Egress__Properties__MonitorBlobAccountKey: "<storage account key>"
For more output options, refer to the egress docs: Egress Configuration
6. Applying the Environment Variables to the Sidecar
Although we have set the Environment Variables on the site level, we still need to apply the necessary ones to the sidecar. Navigate to Deployment Center and select the dotnet-monitor container. Under the Environment Variables section, apply all the Environment Variables starting with DOTNETMONITOR_ to the sidecar. Your configuration should look similar to this when you are done.
Validation
Since we can’t SSH into the sidecar, our main options for validation are through logging and actual data capture. Navigate to Deployment Center > View logs (on the dotnet-monitor) which will give you a log stream. Look for a record similar to the below. It’ll say that the collection rule is started and it is montioring TargetProccessId: X. Note that if there was a restart recently, some logs may be coming from the terminating/terminated container. You’ll have to use your discretion to differentiate between the active and terminating/terminated container logs.
{"Timestamp":"2026-09-07T22:11:55.5405916Z","EventId":40,"LogLevel":"Information","Category":"Microsoft.Diagnostics.Tools.Monitor.CollectionRules.CollectionRuleService","Message":"Starting collection rules.","State":{"{OriginalFormat}":"Starting collection rules."},"Scopes":[{"Message":"TargetProcessId:1 TargetRuntimeInstanceCookie:xxxxx","TargetProcessId":"1","TargetRuntimeInstanceCookie":"xxxxx"}]}
To test the rule, temporarily lower DOTNETMONITOR_CollectionRules__HighMem__Trigger__Settings__GreaterThan to a value such as 100 MB. Changing an Environment Variable restarts the app, and dump collection can briefly increase resource consumption, so perform this test in a staging environment. After the rule triggers, confirm that the dumps appears in the configured Blob container.