Finding Memory Leaks and CPU Usage in Azure Node.js Web App
Slow application performance issues tend to be challenging to troubleshoot regardless of the platform in which your application is running. This is due in great part to the sometimes random nature of these issues. These types of issues also often do not result in a specific error being logged.
If you think your node.js application is running slow and takes more than few seconds to receive response. Below info may help you analyze where it’s taking longer time and also checks for memory leaks. There are many node.js modules to accomplish this(notably)
- v8-profiler
- nodetime(app dynamics)
- look
If you analyze below sample code, I have included memory leak highlighted in Red and CPU intensive work in Amber colors.
/**
 * Created by prmadi on 8/20/2015.
 */

 var http = require('http');
 var port = process.env.PORT || '3000';

 // Memory Leak
 function LeakingClass() {
 }
 var leaks = [];
 setInterval(function() {
 for (var i = 0; i < 100; i++) {
 leaks.push(new LeakingClass);
 }
 console.error('Leaks: %d', leaks.length);
 }, 1000);

 http.createServer(function (req, res) {

 // CPU intensive work
 var fibonacci = function(n){
 if(n < 1){return 0;}
 else if(n == 1 || n == 2){return 1;}
 else if(n > 2){return fibonacci(n - 1) + fibonacci(n-2);}
 };
 fibonacci(40);

 res.writeHead(200, {'Content-Type': 'text/plain'});
 res.end('Hello World\n'+ fibonaccif(40));
 }).listen(port, '127.0.0.1');
I would show you how to use v8-profiler on above sample code to find memory leaks and CPU Usage. More info on v8-profiler can be found @ https://github.com/node-inspector/v8-profiler
- Install v8-profiler module using below command in kudu console at webapp root(D:\home\site\wwwroot) or enter it in package.json file before deploying to azure web apps.
npm install v8-profiler
- Create a folder “debugdump” in your webapp root(D:\home\site\wwwroot).
- Add below lines of code to get heap snapshot
 var fs = require('fs'),
 ws = fs.createWriteStream('debugdump/'+Date.now() + '.heapsnapshot'),
 profiler = require('v8-profiler'),
 snapshot = profiler.takeSnapshot(),
 callback = ws.end.bind(ws);

 snapshot.serialize(function(data) {
 ws.write('' + data);
 }, callback);//begin cpu profiling
- Add below lines of code to get CPU profile
 profiler.startProfiling();

 // code to be profiled here

 var cpuProfile = profiler.stopProfiling();
 var serialized = JSON.stringify(cpuProfile, null, 2);
 fs.writeFileSync('debugdump/'+Date.now() +'.cpuprofile', serialized, 'utf8');
- After accessing your application, you would start seeing few files with cpuprofile and heapsnapshot extensoins in D:\home\site\wwwroot\debugdump folder.
- Download files in debugdump folder and analyze them using tools like chrome developer tools.
Here is my sample code after adding profiler instructions listed above
/**
 * Created by prmadi on 8/20/2015.
 */

 var http = require('http');
 var port = process.env.PORT || '3000';

 function LeakingClass() {
 }
 var leaks = [];
 setInterval(function() {
 for (var i = 0; i < 100; i++) {
 leaks.push(new LeakingClass);
 }
 }, 1000);

 http.createServer(function (req, res) {

 var fs = require('fs'),
 ws = fs.createWriteStream('debugdump/'+Date.now() + '.heapsnapshot'),
 profiler = require('v8-profiler'),
 snapshot = profiler.takeSnapshot(),
 callback = ws.end.bind(ws);

 snapshot.serialize(function(data) {
 ws.write('' + data);
 }, callback);//begin cpu profiling

 var fibonacci = function(n){
 if(n < 1){return 0;}
 else if(n == 1 || n == 2){return 1;}
 else if(n > 2){return fibonacci(n - 1) + fibonacci(n-2);}
 };

 profiler.startProfiling();

 fibonacci(40);

 var cpuProfile = profiler.stopProfiling();
 var serialized = JSON.stringify(cpuProfile, null, 2);
 fs.writeFileSync('debugdump/'+Date.now() +'.cpuprofile', serialized, 'utf8');

 res.writeHead(200, {'Content-Type': 'text/plain'});
 res.end('Hello World\n'+ fibonacci(40));
 }).listen(port, '127.0.0.1');
– Above code has created few CPU profiles and heap snapshots in my debugdump folder as in below screenshot.
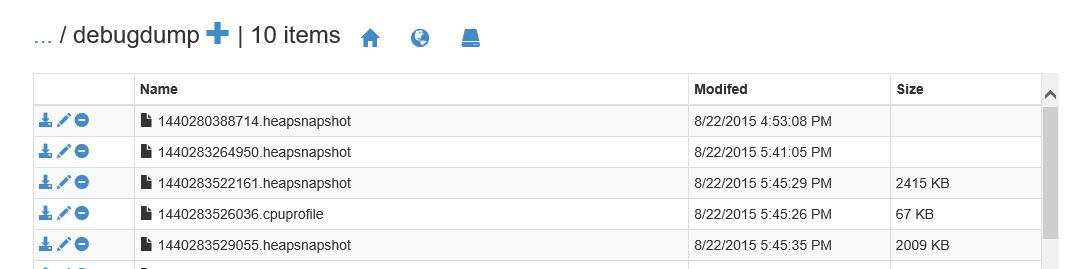
– Load these files into chrome developer tools by selecting chrome developer tools > profiles > load
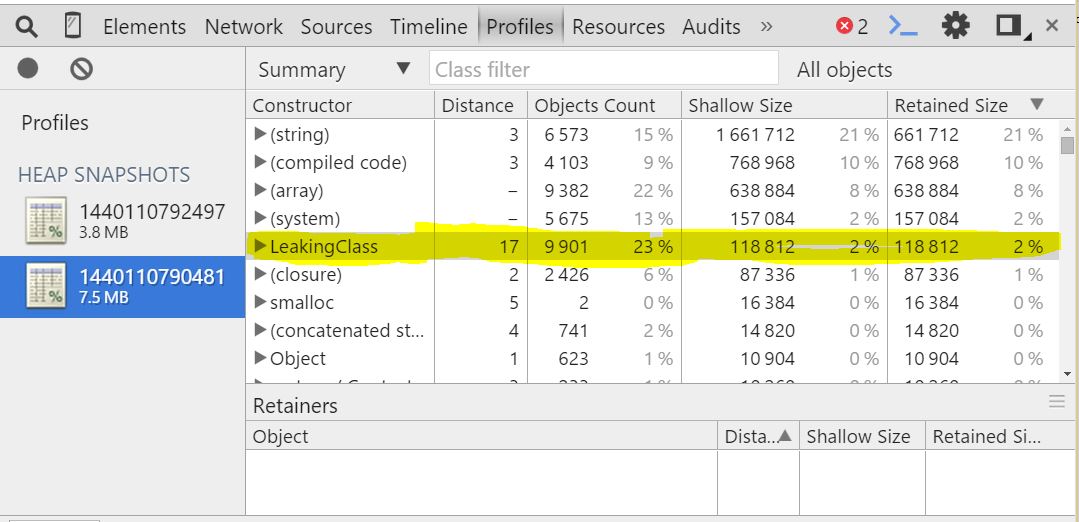
– Below is a sample heap snapshot analysis screenshots. As you can see, Leakclass was the culprit in my above sample code which is visible in heap snapshot.
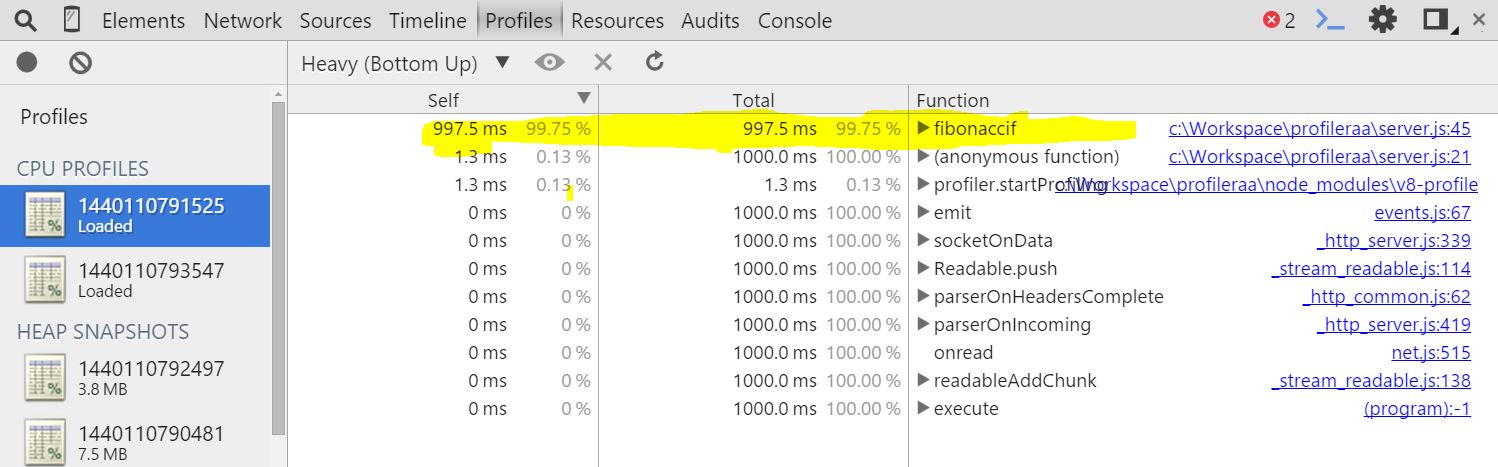
– Below is a sample CPU Usage analysis. As you can see, calculating fibonanci number was CPU intensive operation in my request which is visible in CPU profile.
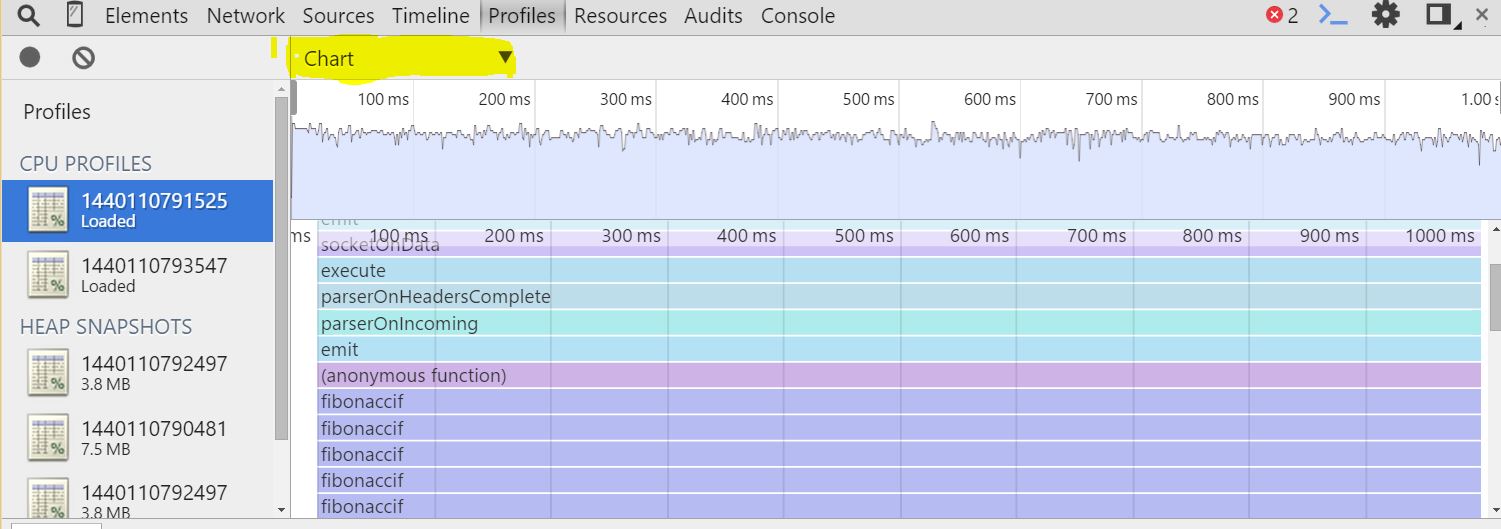
Chart View :
Heavy (Bottom Up) View :