Taking a crash dump of node/java process using the procdump on Azure WebApp
Azure provides built-in diagnostics to assist with debugging Web Applications hosted in Azure App Service Web Apps. In this article, you will learn how to enable procdump to further troubleshoot intermittent node/java process crash issues.
We can analyze the process dump using Visual Studio to understand the root cause of the issue.
Please follow below list of steps to enable procdump :
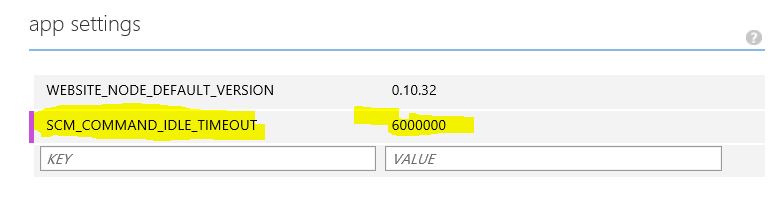
1. Set SCM_COMMAND_IDLE_TIMEOUT to a high value in azure portal -> configure Tab of web app.
2. Open your kudu console(https://Your_Webapp_name.scm.azurewebsites.net/DebugConsole).
3. Browse to the Process Explorer Page -

4. Note down the process id for the process like node.exe or java.exe.
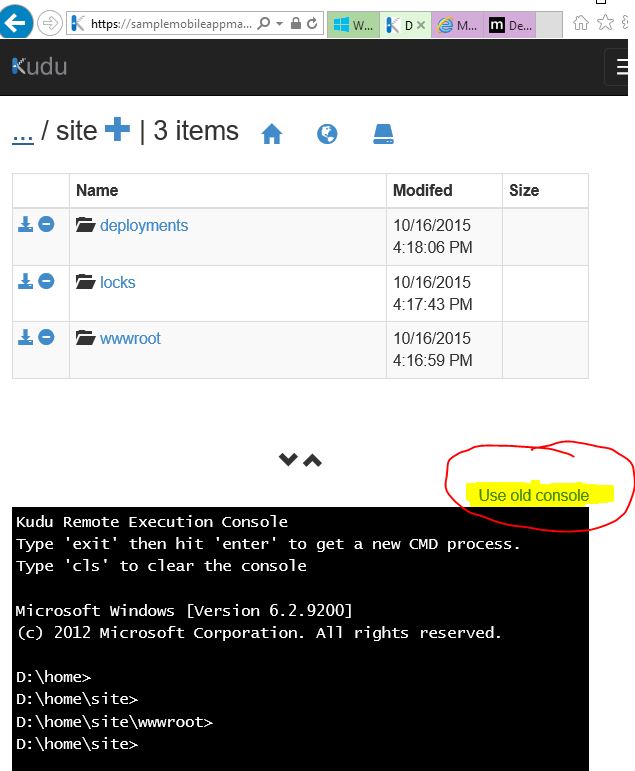
5. Go to the DebugConsole by clicking on the Debug console menu option and select CMD in that.
6. Switch Kudu console to ‘use old console’ (there is a link in there to switch)
- Change the directory to D:\devtools\sysinternals using the command prompt.
Run the below command -
procdump -accepteula -ma <proc id for your process> -t D:\home\site\wwwroot\mydmp.dmp
Here the option “t” stands for terminate. So whenever, your process crashes the dump will be generated in the mydmp.dmp file.
For more options please refer - https://technet.microsoft.com/en-us/sysinternals/dd996900.aspx
You can then download the dump file and open it using Visual studio to get more details for the root cause of the crash.


