Triggering the PHP Process Report on Azure Web Apps
The PHP Process Report can be a vital tool in troubleshooting slowness or errors with your PHP Web Application. This article covers how to trigger the report based on a rule.
Reference
Apurva Joshi has a great article on Diagnostics as a Service (DaaS) for Azure Websites located here: https://azure.microsoft.com/en-us/blog/new-updates-to-daas-diagnostics-as-a-service-for-azure-websites/
Details on the Azure Web Apps Support Portal can be found here by Sunitha Mutukrishna: https://sunithamk.wordpress.com/category/azure/
Let’s get started!
DaaS Web Job
Before the Process Report can be triggered, ensure the DaaS web job is running.
- Browse to http://portal.azure.com
- Select your Web App
- Click on WebJobs
- Ensure DaaS is configured to run continuously

Figure 1. DaaS web job is enabled and running
Support Portal
Now that the DaaS web job has been verified, let’s browse to the Support Portal and configure the alert rule.
- Browse to http://<webapp name>.scm.azurewebsites.net/support
- Select Mitigate
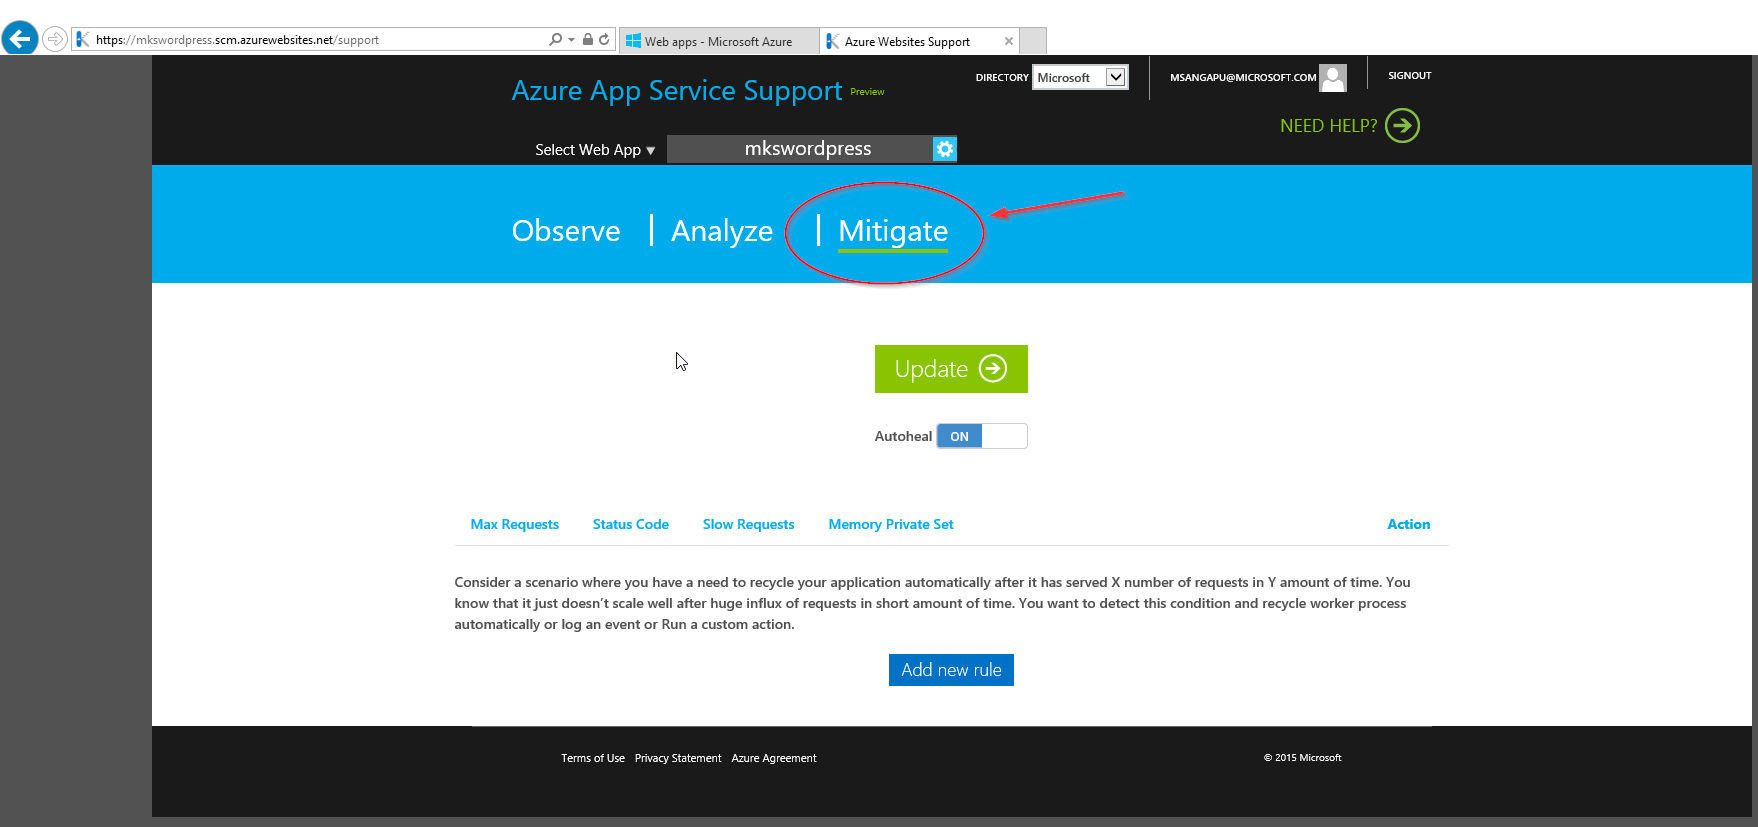
Figure 2. Mitigate area within the support portal showing the “Add new rule” button
Configuring The Alert Rule
There are multiple categories for the rule (Max Requests, Status Code, Slow Requests, Memory Private Set) which can be used. I’ll be using a Status Code in this example.
- Select Status Code
- Click Add New Rule
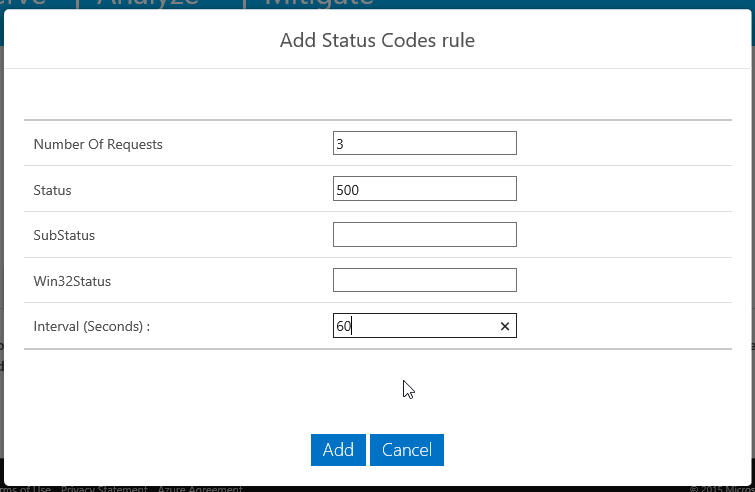
Figure 3. Status Code rule configuration
Setting the Action
Once the rule has been set, click on Action to configure the process to trigger.
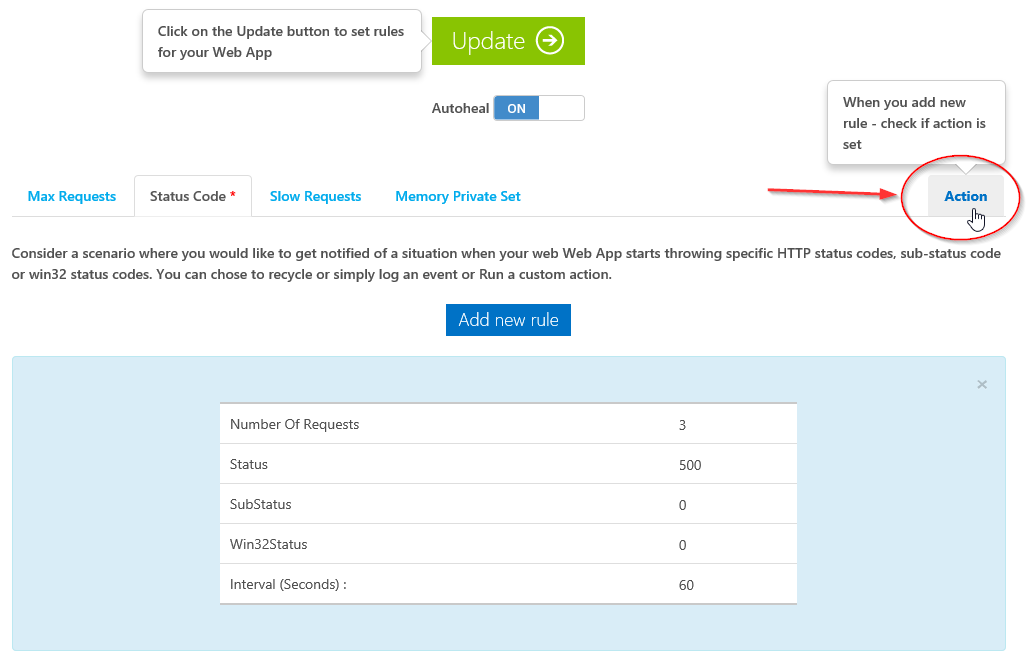
Figure 4. After Status Code rule has been set, action area needs to be configured
- If not already set, the executable field should point to D:\home\data\DaaS\bin\DaasConsole.exe
- Set the parameters to –Troubleshoot “PHP Process Report” 30 as shown below
- Click the green Update button
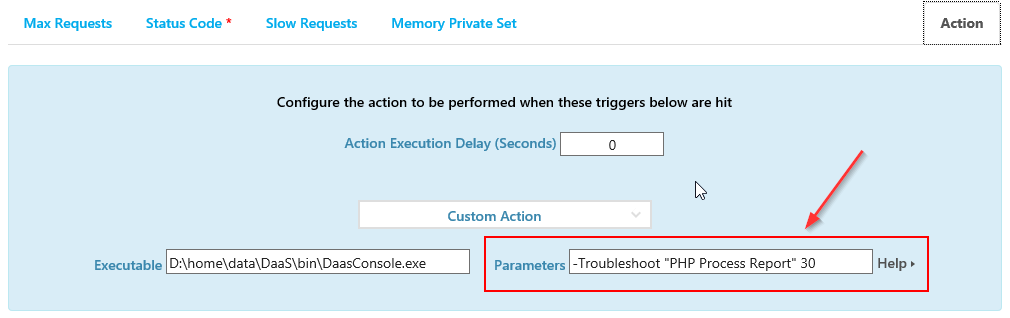
Figure 5. Action area with PHP Process Report configured
That’s it! You have successfully configured an Alert Rule to trigger the PHP Process Report. Please see the reference links for more information. Feel free to post comments or questions below!
…. but wait, there’s more!
Viewing the Reports
Once a report has been executed, it can be seen within the Analyze section of the Support Portal.
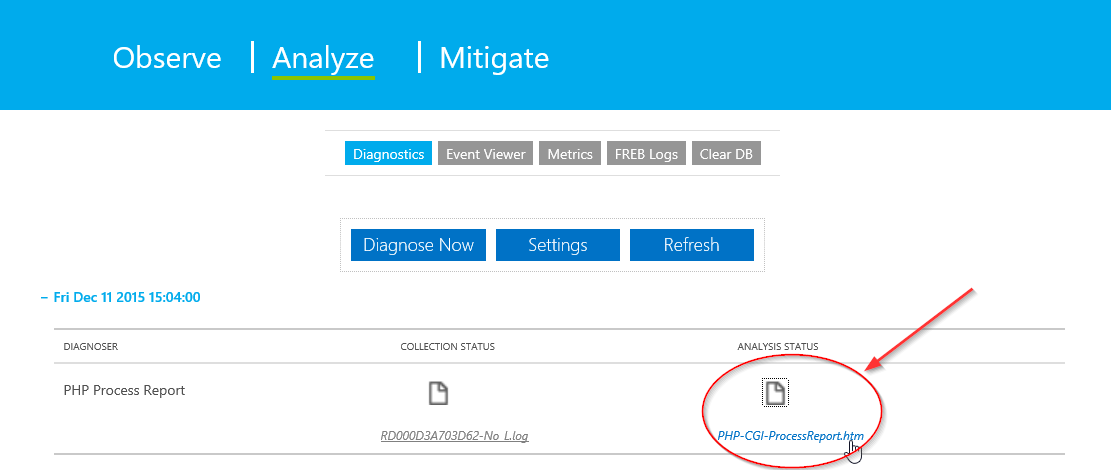
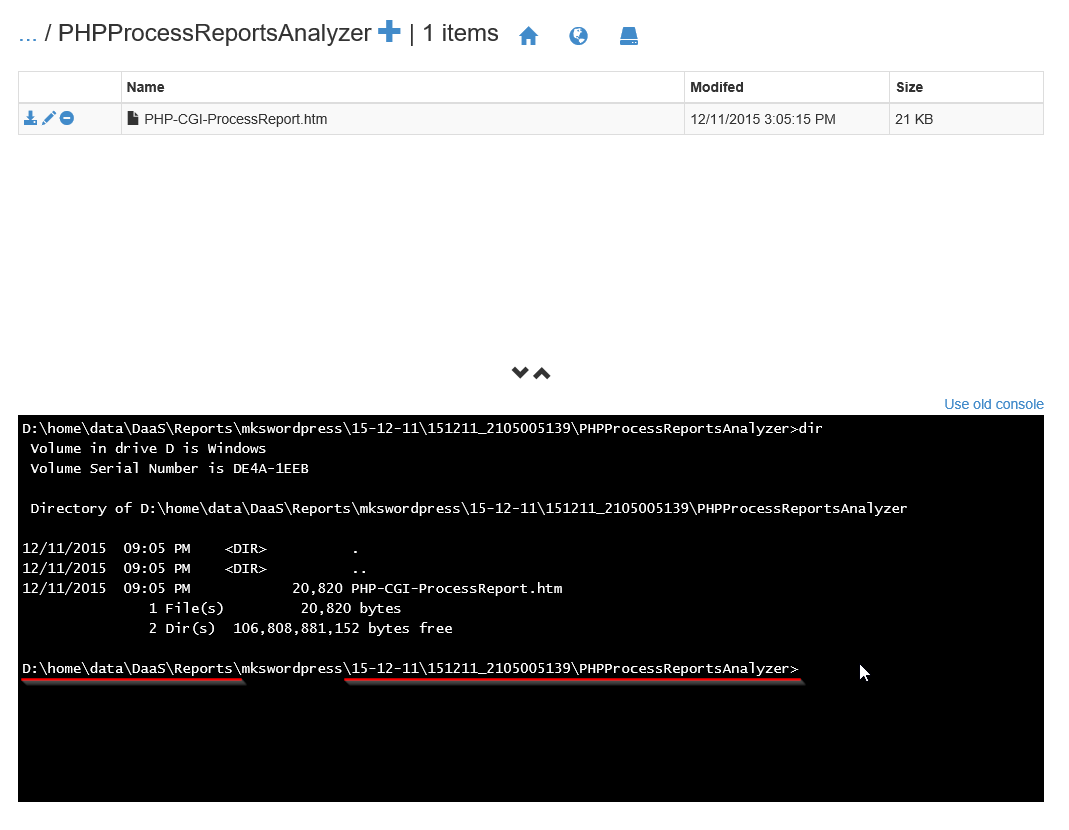
Figure 6. Analyze area showing the PHP Process Report
In addition to the analyze area, the reports can also be found within: d:\home\data\DaaS\Reports\<web app name>\