Maximum Allowed Cores exceeded for the Managed Environment
This post will discuss this message that may be seen on Azure Container Apps.
Overview
This post applies to the following messages:
Maximum Allowed Cores exceeded for the Managed Environment. Please check https://learn.microsoft.com/en-us/azure/container-apps/quotas for resource limits.pod didn't trigger scale-up: 1 max node group size reachedError creating: pods "[pod_name]" is forbidden: exceeded quota
Where can I view these errors?
You may see these errors in system logs
ContainerAppSystemLogs(Azure Monitor)ContainerAppSystemLogs_CL(Log Analytics)- or Log stream
| You can view supporting telemetry such as replica and node counts in the Metrics blade and the [Troubleshooting | Diagnose and Solve Problems](https://learn.microsoft.com/en-us/azure/container-apps/troubleshooting?tabs=bash) blade. |
What do these errors mean?
All three essentially mean at that moment in time, a pod/replica was unable to be scheduled because CPU/GPU/Memory quotas were hit - or - the node pool is unable to be scaled out further, or generally, the pod/replica cannot be scheduled to a node due to some other constraint
pod didn't trigger scale-up: 1 max node group size reachedshould be taken into its literal meaning that a node pool cannot be scaled out to fit the new pod/replica. Or, a node cannot be allocated to fit the new pod/replicaMaximum Allowed Cores exceeded for the Managed EnvironmentandError creating: pods "[pod_name]" is forbidden: exceeded quotaare more literal quota related messages. But can still also be due to the above.
These messages can appear interchangeably.
Symptons
When these errors occur, any net-new pods/replicas will not be schedulable. Which means any containers in them will not be created, the pod lifecycle will not start.
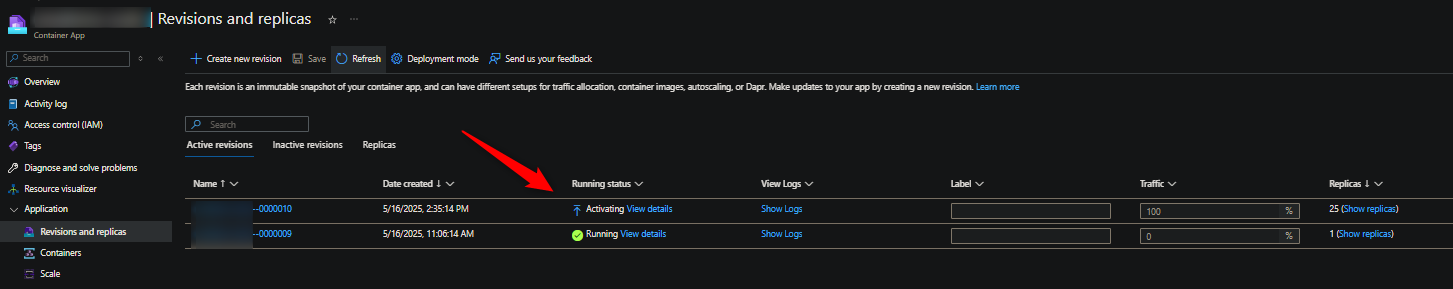
You may notice new revisions will show “Stuck in Activating” (Applications stuck in Activating state - Overview), or Provisoning, and move to Degraded eventually. Revision statuses can be checked in the Revisions blade (amongst other areas):
Essentially, any (but not always all) new pods/replicas will not be runnable - remember, new revisions essentially create 2x the existing pod/replica count. You are much more likely to see these issues during revision creation, especially if they’re using near max quota already. See Container Apps - Demystifying restarts and Zero downtime deployment
Quotas
You define CPU cores for applications at the container level. The sum of these cpu requests, per container, in each pod or replica (in the whole environment) total up towards the overal quota used.
This is further scoped to specific Quota types. Notably quota for Managed Environment Consumption Cores and Managed Environment General Purpose Cores (amongst others). See the above link on how to view quota usage per scope.
When doing some quick calculations on quotas - check which Workload profile the application(s) are using since it’ll have it’s own quota type as mentioned in the earlier link.
If warranted, environmental cores can be increased via a self-serve quota request.
Troubleshooting
The cause of these messages can be triggered by various reasons. Some of the more common ones are listed below. When troubleshooting or investigating these issues it’s best to try to work through these common scenarios and resolutions.
Max quota
This is the most direct reason.
Causes:
- Core quota is being exceeded for the relevant quota profile due to having a combination of apps requesting enough total
cputo hit or get near the limit.
Notes:
This can be a combination of many things, such as a genuinely high number of apps in the environment (that all sum up to requesting near cpu quota limits) - consider splitting a single environment into multiple environments. A high number of apps and high replica counts. High number of apps, replica counts, and doing many operations that double these counts, and so on. You’ll see below that this cause can easily intertwine with other causes below in this blog post.
Resolution
- In these “classic” max quota scenarios, you can:
- Follow the Quota section above to do a self-serve quota request for the relevant CPU profile type
- Alternatively, use another environment for net-new apps if there is a very high amount of apps in one environment and posing as a density issue
- Or, reduce replica counts where applicable
- And/or, reduce CPU requests where applicable
- Aside from 1), these may be viewed as “temporary” measures - but can work depending on the environment and expected workload. In other cases, the direct resolution is a self-serve quota request
Max instances
This section is specifically about workflow profiles using dedicated SKU’s.
Cause:
- A user is setting a static “max instances” count. Either the count is too low for the number of pods/replicas expected to be ran - and/or a mix of that plus requesting very large CPU amounts
Notes
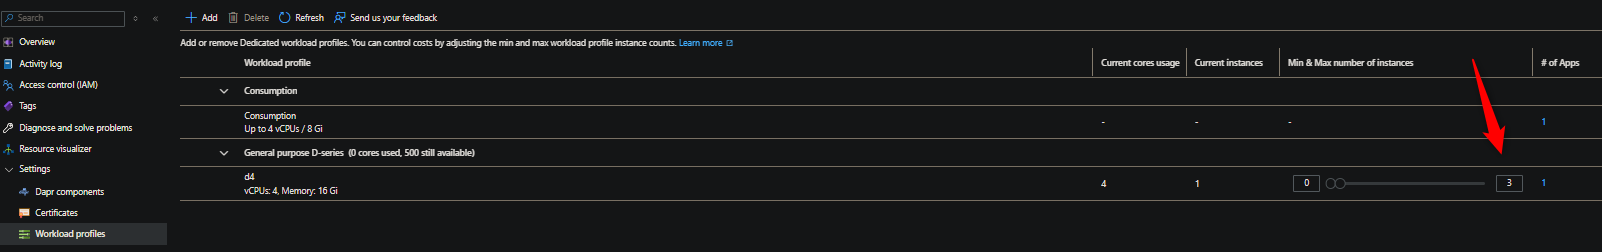
The below screenshot shows a easily reproducile example - which can then be applied to more realistic worloads with some imagination. The below has a min/max node count of 0/3.
And this shows a min/max of 25 replicas for this application that’s running on that d4 profile
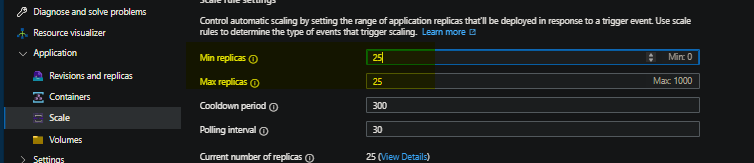
These apps happen to also be requesting 0.5 c of cpu. 0.5 x 25 = 12.5 - while we only have 12 total cores available (4 core nodes x 3 max instances). To resolve this, we should scale out the pool further (or scale up to a higher profile, such as D8) if we want to fix all of these replicas.
In general - common reasons why this may occur is because a user is trying to simply fit either a mix of too many replicas, or, too many replicas across apps plus requesting too high of CPU. It could be something as simple as a max of two node instances - where there are two apps requesting 4 CPU each with 3 replicas. Since a singular D4 node (for example) only has a max of 4 cores, we can see that just 2 replicas out of the 3 will only ever fit. This scenario can happen an infinite number of ways - and will require some scoping and understanding of the expected workload.
This is a scenario where you’ll start seeing pod didn't trigger scale-up: 1 max node group size reached and also potential Maximum cores reached, together in sstem logs.
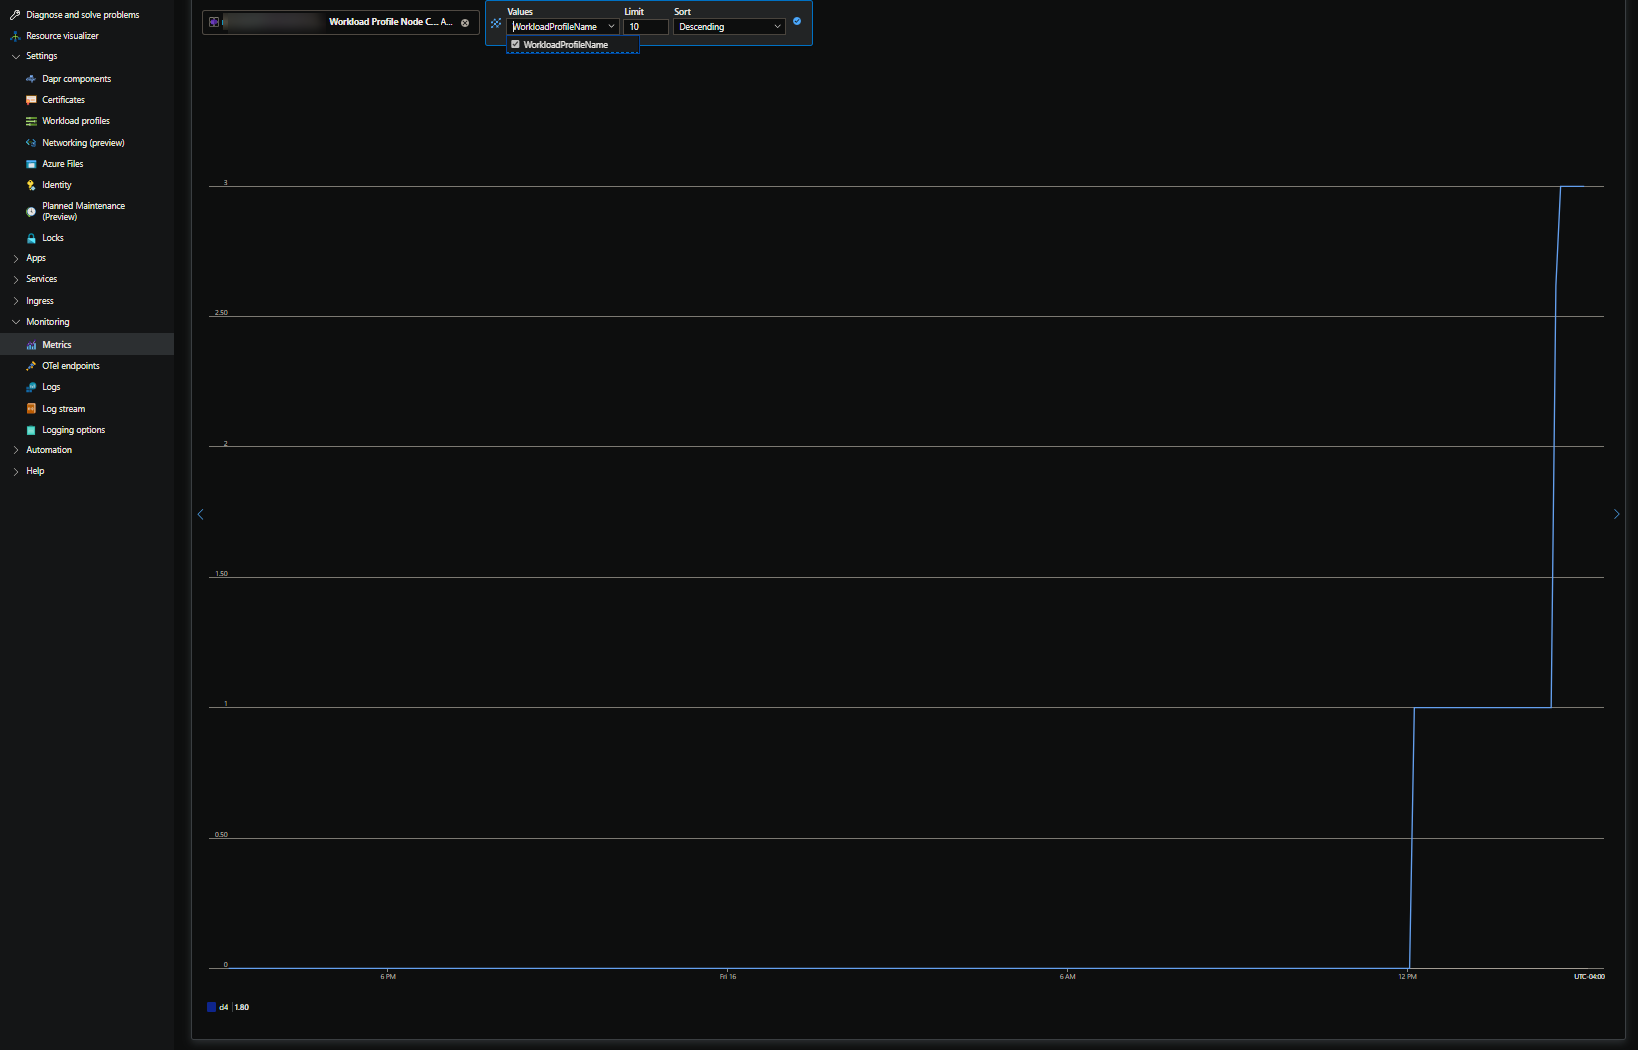
As a side, you can go to your Container App Environment -> Metrics -> Workload Profile Node Count (preview) to get a more real time look of what a workload profile pool is scaling to.
Resolution
- Set a reasonable higher max node count. Depending on the workload - increase the SKU to one with higher cores/memory as well.
- IMPORTANT: You could have more than enough quota, but if you are keeping the max node count to something not realistic for the current workload, you can still easily hit these kinds of issues
Many concurrent updates/operations
This specifically means any kind of update that’ll create new revisions
Cause
- A user is doing concurrent/parallel updates to many apps in their environment which all in turn create 2x the number of set pods/replicas. If they were already close to a CPU quota limit - they may hit it. Otherwise, if enough new pods/replicas are briefly created (depending on their quota limit), they can encounter this
Notes:
Follow the same Investigation steps in Max quota. If workload profiles are used and if its noticed this is mostly happening for apps tied to a specific profile, also follow the steps in Max instances above.
Resolution
-
Avoid too many parallel operations that create new revisions (or new pods, like a revision restart). This was explained in the concept of [Update and deploy changes in Azure Container Apps Zero Downtime Deployments](https://learn.microsoft.com/en-us/azure/container-apps/revisions#zero-downtime-deployment) and Container Apps - Demystifying restarts - - Suggest to stagger updates that create new revisions across apps at
xintervals - If you’re close to hitting (or hitting) quota limits - have them create a self-service quota request (see above)
Burst scaling
This plays into all of the above.
Cause:
- An application may do burst scaling (eg. 0 -> 30 replicas or something to that affect). This may happen across more than one app.
Notes:
This can potentially play into all of the above scenarios where if an environment is already somewhat close to quota, large burst scaling could put this into quota exceeded territory.
There may be more than one app that has scaling to this effect - always check if this kind of scaling is limited to just this one app, or more, and if the overlap timeframes. You can use the Metrics blade (per app) to view replica counts, or, go to the Container App Environment -> Diagnose and Solve Problems - look at Container App Environment Replica Counts
Since scaling out to a large amount of replicas would also mean that nodes would need to be available - if using a dedicated profile - ensure the max instance count is one that makes sense for the amount of cpu requested by the pod multipled by the expected upper limit of replicas intended to be created.
Resolution
- For dedicated profiles: Set a reasonable higher max node count. Depending on the workload - increase the SKU to one with higher cores as well.
- If getting close to quota limits (or scaling/creating enough replicas that they get closer to the limit), do a self-serve quota request
Lack of subnet space
IMPORTANT: If the environment doesn’t have a custom VNET, this doesn’t apply
Cause:
-
Too small of a subnet space as per what’s defined here: [Configuring virtual networks Azure Container Apps environments Microsoft Learn](https://learn.microsoft.com/en-us/azure/container-apps/custom-virtual-networks?tabs=workload-profiles-env#subnet)
Investigation:
For v1 and v2 environments where applications are using a Dedicated Profile - the error will still most likely just be max node pool reached repeatedly happening and ideally if an attempt at scaling out for nodes (likely meaning the application had an event which created more replicas, which needed more nodes). For applications that are using a Consumption profile, this is just looked at from a per-replica basis.
The simplest method to this is to look at the subnet size used on the Container App Environment.
Resolution:
- Redeploy the environment with a larger subnet size, or, better manage scaling of nodes (or replicas, which will possibly affect nodes) - or just replicas (if on a Consumption profile).
- You cannot change the subnet to a new/different one without redeploying the environment. You must redeploy the environment with the new subnet if this option is chosen.
| This doc ([Configuring virtual networks Azure Container Apps environments | Microsoft Learn](https://learn.microsoft.com/en-us/azure/container-apps/custom-virtual-networks?tabs=workload-profiles-env#subnet)) explains the subnet size and max nodes or replicas (depending on the profile and environment) - and as seen in the below table: |
| Subnet Size | Available IP Addresses1 | Max nodes (Dedicated workload profile)2 | Max replicas (Consumption workload profile)2 |
|---|---|---|---|
| /23 | 498 | 249 | 2,490 |
| /24 | 242 | 121 | 1,210 |
| /25 | 114 | 57 | 570 |
| /26 | 50 | 25 | 250 |
| /27 | 18 | 9 | 90 |
GPU
This is specific for an app using a GPU profile
Cause
- Not have enough GPU in the profile to handle the number of pods/replicas
Notes
The error in this case will be the same as mentioned above, notably the Maximum cores exceeded error. There is a first-come-first server for GPU access - Considerations
Resolution
- Request a GPU quota increase if warranted. Or, reduce the replica count they’re attempting to run.
Pending node pool scale out
This section differs in the sense that you may very briefly see the messages at the top of this post - but would likely see no real impact. This also is not a common scenario.
Cause:
- An event to create a new pod/replicas happens which also requires the node pool to scale out to fit these new pod/replicas. A large burst scaling event is one example. This would transitively be shown.
Resolution
- For workload profiles, depending on the workload, set a higher minimum node count.
- If using workload profiles, consider using Consumption profiles - a bit more explanation on the profile is explained here
Consumption-only environment considerations
- If a VNET has a networking set up that is not following Required traffic rules, then this can potentially cause the auto-scaler to fail when needing to start scaling out the node pool or start scheduling pod/replicas to another node pool if a specific pool is near its limits.
- For example, a user creates a Consumption-only environment with a VNET. This runs fine - but at some point later they change VNET characteristics which blocks required traffic. Now, when some activity has occurred to schedule new pods and if the pool that has reached its limit, new pods cannot be scheduled to another pool. Which now may manifest as
pod didn't trigger scale-up: 1 max node group size reachedand subsequentiallyMaximum Allowed Cores exceeded for the Managed Environment - A lack of subnet space/subnet space exhaustion will cause the node pool to not scale out and may show as a
Maximum Allowed Coresmessage
- For example, a user creates a Consumption-only environment with a VNET. This runs fine - but at some point later they change VNET characteristics which blocks required traffic. Now, when some activity has occurred to schedule new pods and if the pool that has reached its limit, new pods cannot be scheduled to another pool. Which now may manifest as
If using (or wanting to use) User Defined Routes (UDR) or NAT Gateway with a Consumption-Only environment - use a Workload Profile environment instead. As UDR’s can be a source of these unintended problems.
Most other aspects in this post still apply to Consumption-only environments, aside from Dedicated SKU configurations.


