Applications (and revisions) stuck in activating state on Azure Container Apps
This post refers to issues where you may see revisions “stuck in ‘Activating’ state” when using Azure Container Apps - and what are some common causes and explainations behind this.
Overview
The concept of Revisions has various “states”. States will change depending on the status of pods/replicas associated with that revision. Operations (such as create/update operations with a revision) or runtime activity will influence these states. These states is what’s referred to here in Running status
This post will also apply to revisions marked as “failed” or “degraded” since eventually Activating state will eventually move to either Failed or Degraded based on the below.
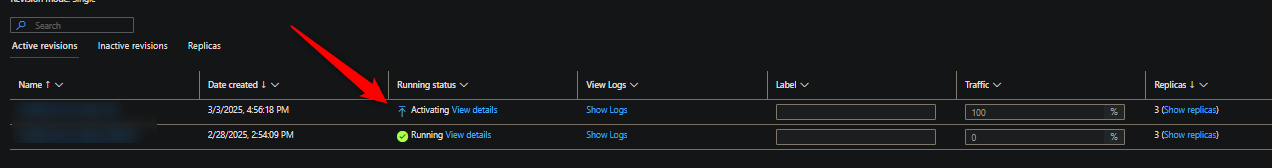
This state/status is specific to a Revision - and is shown under the Running status. When a new revision is created (or switched to), it will go through a series of states. “Activating” is typically what’s seen, the time spent in this “Activating” status will depend on how long it takes for the application (eg. pods) to return a “Healthy” status. If pods were unhealthy due to containers starting to crash, this would move to Degraded or Failed
NOTE: Remember, a revision is associated with a pod/replicas - tied to that specific revision. The application containers runs in a pod.
The below is a general flowchart on how it may end up in these states. This can be used as a general guideline. Other states not related to this can be found in Running status
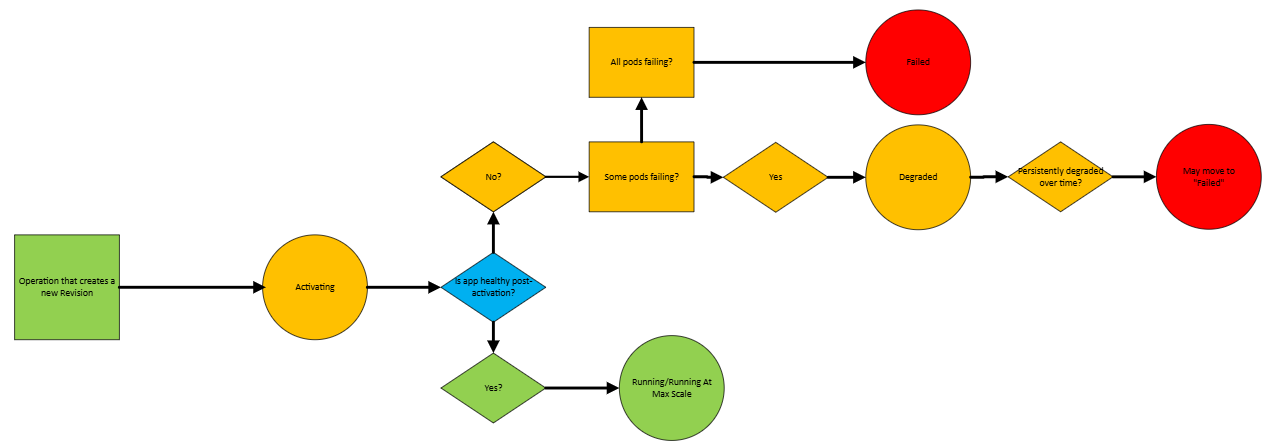
One of the main reasons you may notice this “stuck in Activating” is because in some cases (unless immediately failing), it may take a minute or more to report back a status after the Activation state. For example, misconfigured ingress would generally take a few minutes to report back a “Failed” status since this inherently may take a few cycles of probe failures/unhealthy responses to determine a revision is unhealthy.
- The above may be more apparent with certain scenarios over others. This is covered below.
Key takeaway: “apps stuck in ‘Activating’ state” is essentially synonymous to an app being down, unavailable, or inaccessible (if a previous/other revision is “Healthy” and serving traffic, then only that specific revision “stuck in activating” is affected). This can either be due to runtime errors (app failing to start or exiting), misconfiguration (eg. wrong ingress, missing secrets/env vars, etc.), or, issues like CPU quota exhaustion. Slow starting applications will cause a revision to remain in an Activating state for a longer period if switching to it or creating a new revision.
NOTE: If you want a Revision Status to be reported back sooner, use the Refresh button in the Revisions blade. If this continue to show ‘Activating’ after a few minutes, it’s worth going through the points in this blog post.
Common reasons
The below reasons (and others) can all cause “stuck in activation state”. These would also apply to Failed or Degraded revisions.
Issues that may be more relevant to having “Activation” status stick around longer is Ingress misconfiguration/port mismatch issues, Health Probe failures, slow starting applications, and pod creation failures (due to CPU quota issues). However, all common application scenarios can and should be reviewed where relevant.
Top relevant scenarios:
- Incorrect probe settings or persistent Health Probe Failures that mark a pod as not ready (that fail to the point of restarting the container) - See Troubleshoot health probe failures in Azure Container Apps and Container Apps: Troubleshooting and configuration with Health Probes
- Misconfigured ingress sending traffic to the wrong app port - If your application listens on 8090 but your
TargetPortis set to 8080, this is a classic example of what may cause this. See Troubleshoot target port settings in Azure Container Apps and Container Apps - ‘Target port does not match the listening port’ - CPU quota exhaustion - all environments have a CPU core limit which also depends where the workload is running (for example, Consumption profiles vs. Dedicated profiles). If this is hit, you may notice that new revisions may be in ‘activating’ longer than normal - in most cases this usually moves to ‘degraded’. It is highly recommended to review Quotas for Azure Container Apps and Request quota changes for Azure Container Apps. A blog post can be found here for this - Maximum Allowed Cores exceeded for the Managed Environment
- Slow starting applications - applications that are slow starting may hit compounded issues if health probes are also set to defaults, which may be more aggresive, and subsequent failures to this may cause the revision to eventually enter a failed state. It is heavily advised to change health probes based on the startup behavior/logic of your application.
Common application scenarios:
NOTE: These typically may switch to a “Failed” status much sooner, almost immediately. However these are all still common scenarios worth going over. You should look at Container Apps and Failed Revisions which covers these common scenarios as well
- Container Create Failures. These would be your
OCI runtime create failurebased messages fromcontainerd. See Container Apps - Troubleshooting ‘ContainerCreateFailure’ and ‘OCI runtime create failed’ issues - Container crashing or failing to start. This can be any kind of fatal error at runtime or during application the application start process. See Container Apps - Backoff restarts and container exits
- no space left on device - This more or less falls into the category of
ContainerCreateFailedbut can happen due to more than one reason. See ‘no space left on device’ with Azure Container Apps - Images failing to pull will cause revisions to eventually be marked as failed. See Troubleshoot image pull failures in Azure Container Apps and Container Apps: Troubleshooting image pull errors
- Storage mount failures will also cause revisions to eventually be marked as failed. The point in a pod lifecycle where this fails will not have any containers be created - so this may show no pod/replicas running in these cases. See Troubleshoot storage mount failures in Azure Container Apps and Troubleshooting volume mount issues on Azure Container Apps
Reviewing logs to investigate issues
Reviewing logs is one of the arguably most important peices here. You can set logging on the Container App Environment by going to the Logging options blade, or, during creation of the environment. If this is set to “none”, this will not persist logging and can only be viewed via Log stream. This is not recommended.
You can view logs afterwards by going to the Logs blade and writing queries based on if you have Azure Monitor or Log Analytic selected.
- Azure Monitor will use the
ContainerAppConsoleLogs/ContainerAppSystemLogstables - Log Analytics will use the
ContainerAppConsoleLogs_CL/ContainerAppSystemLogs_CLtables- Note the addition of the
_CLsuffix. Examples of these queries are found here (Log Analytics). Use the same query structure for Azure Monitor but just exclude the_CLsuffix in table names or column names
- Note the addition of the
You can also use the Detectors in the Diagnose and Solve Problems blade on your Container App which can be used to check if specific errors are being hit.


