Container Apps: Troubleshooting and configuration with Health Probes
This post will cover some troubleshooting and configuration when using Health Probes for applications hosted on Container Apps.
Overview
Since Azure Container Apps is built ontop of Kubernetes, there is a fair amount of Container App features that are mapped pretty closely conceptually with ones existing on Kubernetes.
One of these is Health Probes - which can be a great way at determining application health when pod movement happens and over the course of time in a normal running application. These Health Probes are built ontop of Kubernetes Health Probes - so, reading through the official Kubernetes documentation can be insightful as well.
Health probes can help work around performance issues related to timeouts during container startup, deadlocks when running the container, and serving traffic when the container is not ready to accept traffic.
Below we’ll cover some general probe information on Container Apps and some troubleshooting scenarios as well.
NOTE: Overall, it is encouraged to play around with probe configurations to see what best bits the application need and use case.
Request flow
Probes originate from within the managed Container App environment, much like it would do with typical Kubernetes - from kubelet - or you may notice a different user-agent with applications hosted on Consumption profiles. This is a separate flow from compared to requests from external clients like browsers or other applications that would come through ingress.
Probe mechanisms and restrictions
Supported mechanisms are:
- HTTP(s) and TCP
Current restrictions are:
- gRPC, named ports, and exec commands are not supported. See here
- You can only add one of each probe type per container.
For a HTTP probe to be deemed successful, the response from the configured endpoint must be between HTTP 200 - HTTP 399.
Configuration
Default configuration
When enabling ingress on an application - The Container Apps platform has default TCP Health Probe configurations set. For public documentation, see here. The port set for Port on the TCP probe would be set to what was specified as the ingress port.
Because of this, you may notice messages in the ContainerAppSystemLogs_CL Log Analytics table about various probe messages. Since defaults will be set - this would potentially be expected to see. Probes are part of Kubernetes (and by extension, Container Apps) way of determining pod health.
Below is what you would see if you have not explicitly enabled Health Probes by going to the Containers -> select the container to edit -> Health Probes blade:
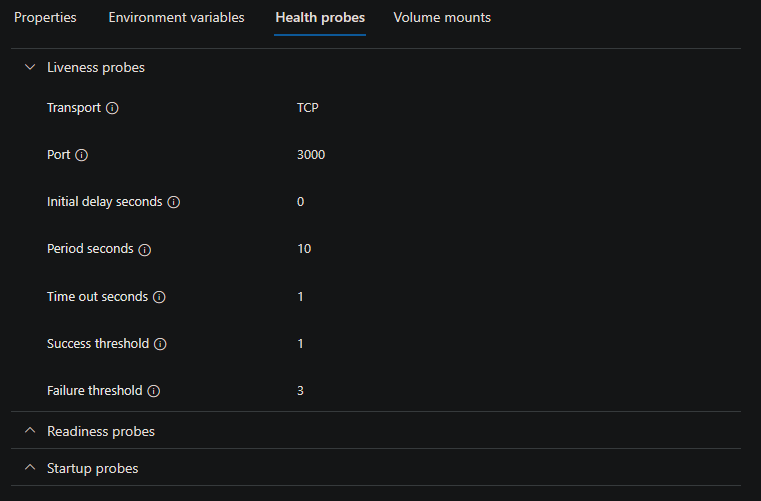
Reasoning about why TCP over HTTP would be set is because TCP would only check the presumed exposed port (which is set when enabling ingress unless otherwise configured in the Probe configuration itself). If HTTP was used, there is a potential that any route that is “guessed” to ping the application on - could return a non 200 - 400 HTTP status code, thus always marking the container as failed, right away.
General configuration
HTTP(s) and TCP Health probes are configured in the “probes” section inside the “containers” section of a Container App
Refer to this example for health probe configuration schema and supported settings. Furthermore, if using HTTP as the probe mechanism, you will need to implement an HTTP endpoint within the application code that contains health status logic. An example is shown here.
For TCP Health Probes - there should be an accessible port exposed in your Dockerfile
Request headers and User-Agent
Consumption-only environments:
The default user-agent and headers sent by Kubelet for HTTP Health Probes is defined here - Kubernetes - HTTP Probes.
If you wanted to see this programmatically, the incoming request headers could be logged out to console/stdout/stderr. This would then be viewable in ContainerAppConsoleLogs_CL
For example, with node.js, you would log out req.headers - eg., console.log(req.headers). The full headers initiated by Kubelet looks like the below:
{
  host: '100.100.0.23:3000',
  'user-agent': 'kube-probe/1.25',
  accept: '*/*',
  connection: 'close'
}
host: Should match the Pod IP address - the port on this address should be the ingress port configured if the default Health Probes or used - or, if Health Probes or explicitly used - the port set for said Health Probe typeuser-agent: This should match the version used on the cluster. This is set by Kubelet.- It is possible to override this header by adding a custom header in the Health Probe “Additional Settings” section. Add a key with
User-Agentwith a value of the desired agent name.
- It is possible to override this header by adding a custom header in the Health Probe “Additional Settings” section. Add a key with
Dedicated environments:
For “Dedicated” (Workload-profile or consumption) based environments, the incoming request object will vary slightly. This will look like the following instead:
{
  host: 'locahost:3000',
  'user-agent': 'curl/7.86.0',
  accept: '*/*',
}
HTTPS probes
Source code examples of HTTP and HTTPS probe usage for various runtimes can be found here: azureossd - container-apps-health-probe-examples
If HTTPS probes need to be set up, the application/container will need to be accepting traffic over a server also configured for HTTPS traffic. You can run an application that accepts both HTTP and HTTPS traffic.
This can be tested locally first to validate this would work on Container Apps - you could generate self-signed certificates and use these and then test over https://localhost:<port>.
An example of Python and Gunicorn would be something like the below - which would accept traffic over both HTTP and HTTPS:
gunicorn -b 0.0.0.0:8000 app:app --timeout 600 --access-logfile "-" --error-logfile "-" & \
    gunicorn -b 0.0.0.0:8443 app:app --timeout 600 --access-logfile "-" --error-logfile "-" --certfile /app/certs/example.com.crt --keyfile /app/certs/example.com.key
Since these probes are based off of Kubernetes probes, certificate verification will be skipped as explained here which should also ignore warnings from self-signed certificates.
If the application is not properly configured to listen over HTTPS you will likely see a Connection Refused from the Health Probes or Get "https://x.x.x.x:<port>/": http: server gave HTTP response to HTTPS client
Note: This will cause a revision to be marked as failed, see the troubleshooting section below for further details
Troubleshooting
Log Analytic Queries
You can see Health Probe related messages in ContainerAppSystemLogs_CL.
This needs to be ran in the Logs blade on the Container App in the portal. Most of these messages, if anything related to Health Probes directly, will only show warning or error related information. It will not show each time a probe is called that is successful.
Below is example of output that would be seen in this table - both TCP and HTTP Health Probe failures will appear in this table:
Liveness probe failed: HTTP probe failed with statuscode: 500
Container some-http-probe-node failed liveness probe, will be restarted
If there is stdout/stderr that gets logged out when the probe hits the specified path for an HTTP Health Probe, this would be logged out in ContainerAppConsoleLogs_CL
If you want to know when a probe request is initiated to the specified endpoint, the easiest way is to add some type of console or print statement in the relevant application endpoint logic.
Behavior seen when probes are failing
If a probe is not returning a status code between 200 - 399 with the specified criteria - or the specified port is not accessible, then this will be marked as unsuccessful, this will also depend on which probe is being used as what is seen may differ.
Portal
This behavior will manifest for both HTTP(s) and TCP probes
NOTE: For any of the failing revisions below, it may take a few minutes to update the status of Provisioning and Running. Additionally, there may be a brief period where is shows as “successful” before it flips back to “failed”.
Liveness: A liveness probe that is failing may show as the below in the Revisions blade for said revision that has failing probes:

In the Overview blade, the revision will show as failed in this manner:

Startup: A startup probe that is failing may show as the below in the Revisions blade for said revision that has failing probes:

In the Overview blade, the revision will show as failed in this manner:

Readiness: A readiness probe that is failing may show as the below in the Revisions blade for said revision that has failing probes:

In the Overview blade, the revision will show as failed in this manner:

Compared to Liveness and Startup probes, which will keep restarting the container failing, Readiness probes will continue to run and do not explicitly restart the failing container in the pod.
This behavior was called out in Kubernetes - Configure Probes. This can give some semblance of reason for the behavioral difference.
External
If trying to hit the FQDN of the failing revision - you may get a stream timeout error from Envoy.
Common errors
Connection refused
This can happen for many reasons and is not always indicative of an actual error. For example, this will commonly show when containers are starting in pods.
This can be again be triggered by numerous events, such as Container App updates that create new revisions, pod/replica movement, etc. This in itself could be deemed noise.
This will also typically be seen when default probes are enabled, since they use TCP - or - if TCP probes in general are used.
If the container is not yet ready to accept requests from the TCP port, we’ll get a Connection Refused. Example output:
Startup probe failed: dial tcp 100.100.0.18:3000: connect: connection refused
This same issue can happen for HTTP ports specified that aren’t actually being listed on/exposed - however, that is a fundamentally different reason/issue (explained below).
-
A TCP probe will ping at the IP of the pod and the port of the exposed container - this check is called out here Kubernetes - Pod Lifecycle - Check Mechanism
-
An HTTP(s) probe will ping at the IP of the pod and the port - along with the specified path (if any). TCP probes do not have the option to point to a path.
This can happen especially when using the default configuration, or, potentially when “Initial delay seconds” is set to a very low value.
When you do not specify your own probes, Startup, Liveness and Readiness TCP probes have a default “Initial delay seconds” of one (1) seconds. A minimum of zero (0) seconds is also an allowed value. Given this, if one does not want to see these connection refused messages - they can try to set “Initial delay seconds” to a higher value.
For slow starting applications - review here - where a mix of using a Startup Probe to push back Liveness and Readiness probes being called can be done - or, a mix of initialDelaySeconds as well - using Startup Probes:
- Container Apps - Health Probes - Default Configuration
- Kubernetes - Protect slow starting applications
An actual issue that can occur and would show up as connection refused - is if one sets the HTTP(s) or TCP probe port to a port that is not actually exposed by the application container. For example, an application that only exposes port 3000 but an HTTP probe has it’s port specified to 3001.
Liveness probe failed: Get "http://100.100.0.37:3001/probe/http": dial tcp 100.100.0.37:3001: connect: connection refused
As opposed to connection refused messages where the pod is simply starting - there a few key differences here:
- Compared to
connection refusedwhere this is in relation to a pod and containers within starting, this may only show a few times, and afterwards, the pod should be marked as running and the application accessible - When an incorrect/not exposed port is set for an HTTP(s)/TCP probe, this message may keep appearing. Ultimately the revision may show as in a “Failed” state
Between HTTP and TCP port failure messages, this can be distinguished in some way since HTTP probes require a path to be set, for example, the below is an HTTP probe targeting a non-exposed port (thus failing health probes):
Startup probe failed: Get "http://100.100.0.53:3001/": dial tcp 100.100.0.53:3001: connect: connection refused
While the below may be TCP having the same problem:
startup probe failed: connection refused
Probe failed with statuscode: 404
You may see HTTP probe failed with statuscode: 404, for any of the configurable HTTP probes. Example output which will show in ContainerAppSystemLogs_CL:
Readiness probe failed: HTTP probe failed with statuscode: 404
Startup probe failed: HTTP probe failed with statuscode: 404
Liveness probe failed: HTTP probe failed with statuscode: 404
Effects from probe failure are called out in the Log Analytics ContainerAppSystemLogs_CL table:
Container some-container failed startup probe, will be restarted
Container some-container failed liveness probe, will be restarted
Understanding the issue:
- Review and confirm if the path specified that is returning a 404 actually exists
- If the site is public, you can hit the FQDN of the application and append the path specified to see if it returns a 404 for yourself
- If this is being set to a non-existent path, review documentation where the application needs to return a status code between 200 - 399
- In some runtimes - for example, Tomcat (Embedded Tomcat with .jar’s or Tomcat running war’s), a 404 can actually indicate an application-related error. This can be the same case for NGINX. If this is the case, review
ContainerAppConsoleLogs_CL/ Application Logs to see if there is any application stderr being written
Probe failed with statuscode: 500
You may see HTTP probe failed with statuscode: 500, for any of the configurable HTTP probes. Example output which will show in ContainerAppSystemLogs_CL:
Readiness probe failed: HTTP probe failed with statuscode: 500
Startup probe failed: HTTP probe failed with statuscode: 500
Liveness probe failed: HTTP probe failed with statuscode: 500
Effects from probe failure are called out in the Log Analytics ContainerAppSystemLogs_CL table:
Container some-container failed startup probe, will be restarted
Container some-container failed liveness probe, will be restarted
Understanding the issue:
- If the 500’s are consistent, review the logic in the endpoint specified. HTTP 500’s are typically indicative of an application error.
- If not already implemented - add logging to the endpoint specified, especially if it has any logic that makes external calls or does internal logic for various testing. This would then show in
ContainerAppConsoleLogs_CL: - As an example, here is a call to a non-existent endpoint which will throw a 500 -
const res = await axios.get("https://g00gle.com") - This now shows up in ContainerAppConsoleLogs_CL:
AxiosError: getaddrinfo ENOTFOUND g00gle.com - Having this logging to console implemented as well as an understanding of logic in the path specified for Health Probes can quicken troubleshooting
Probe failed with statuscode: 502
You may see HTTP probe failed with statuscode: 502, for any of the configurable HTTP probes. Example output which will show in ContainerAppSystemLogs_CL:
Readiness probe failed: HTTP probe failed with statuscode: 502
Startup probe failed: HTTP probe failed with statuscode: 502
Liveness probe failed: HTTP probe failed with statuscode: 502
Effects from probe failure are called out in the Log Analytics ContainerAppSystemLogs_CL table:
Container some-container failed startup probe, will be restarted
Container some-container failed liveness probe, will be restarted
Understanding the issue:
- Confirm the logic in the specified probe endpoint. Confirm if there is any additional dependencies that are called outbound and if they are reachable.
- Review if the status code returne is handled the logic in the endpoint.
-
NOTE: It is entirely possible to return a 502 (or any other status code) through application code instead of just letting the web server do this after some predefined internal timeout
-
Probe failed: http: server gave HTTP response to HTTPS client
The full message seen would be along the lines of Liveness probe failed: Get "https://xxx.xxx.x.xx:xxxx/some/path": http: server gave HTTP response to HTTPS client
Essentially, this error means that an HTTPS probe was specified for a path that does not accept HTTPS requests. With most application runtimes and their associated serves - to be able to accept HTTPS requests would require setting up the server with a certificate to properly enable this.
Understanding the issue:
- Confirm that the application does actually have an HTTPS server enabled. With most runtimes and web servers it is possible to specifiy both HTTP and HTTPS servers to be ran at the same time, or, enable one server to serve both HTTP and HTTPS requests
- Confirm that the web server is appropriately set up for HTTPS usage. This can easily be validated locally and is recommended to test the application is able to run locally on both HTTP and HTTPS first.
- If using a self-signed certificate, this may show a “warning” in the browser regarding certificate usage - but this can be bypassed and localhost still be accessible over https.
NOTE: As called out in the HTTPS Probes section above - Kubelet skips certificate validation, so self-signed certificates can be used.
Connection refused for 3501/v1.0/healthz
This message will manifest as [some probe] failed: Get "http://xxx.xxx.xx.xx:3501/v1.0/healthz": dial tcp xxx.xxx.xx.xx:3501: connect: connection refused
If this appears, this is should only appear if Dapr is enabled. Seeing this is essentially noise, and explained in the “Connection Refused” message, generally not an issue. This message is for probes to the Dapr sidecar container, when Dapr is enabled.
If this does show, this is typically if there is pod movement or other activity.
All in all, this is not generally indicative of an issue.


