Profiling Java process on Azure web apps
There are certain situations when your Java web application is not performing as you expect it to. To understand where the problem lies, you may need to profile your application and understand its behavior for different flows. Azure App Service environment being a sandbox environment, does not support to install JProfiler and not even expose the JMX information, which can be read by Jconsole to profile your application. The way to profile you application on Azure App Service environment is by using the New Relic tool. Follow these steps -
-
Create a New Relic APM account on Azure portal.
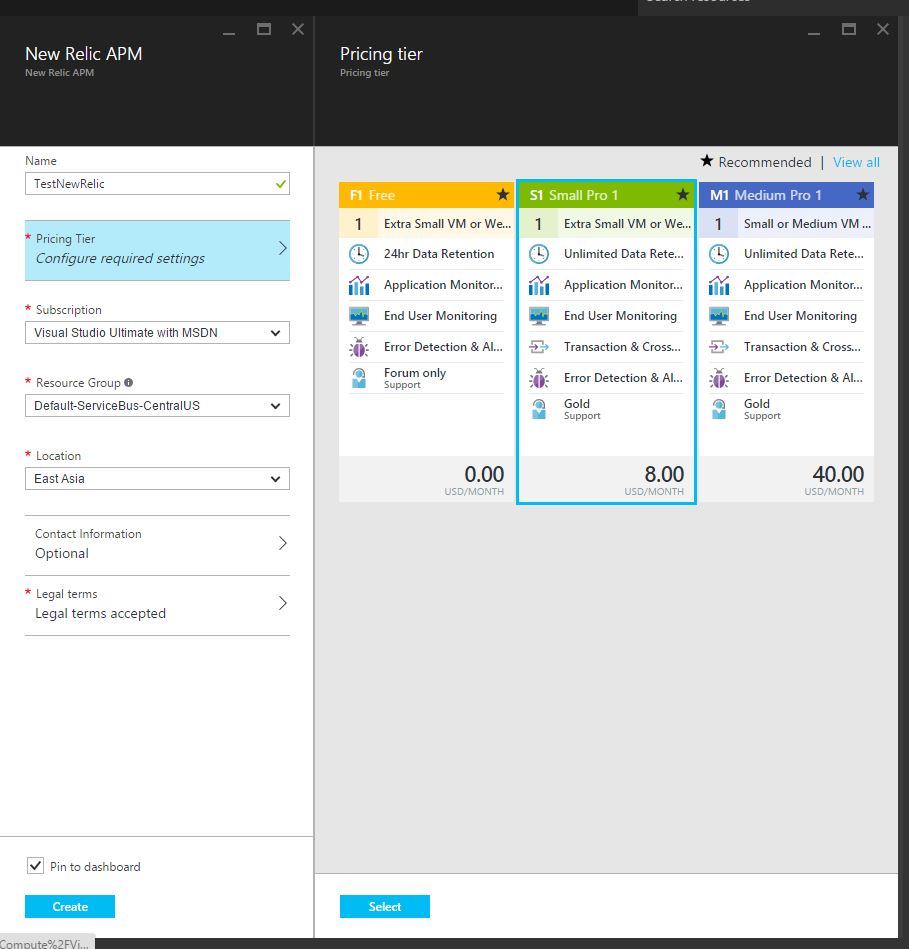
New Relic account Make sure you select at least the Small Pro in the pricing tier.
-
Open the New Relic APM and click on the View at New Relic link as highlighted. \
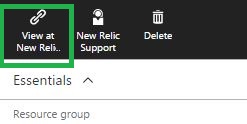
View at New Relic
-
Click on Browser and Install a New Relic APM agent.
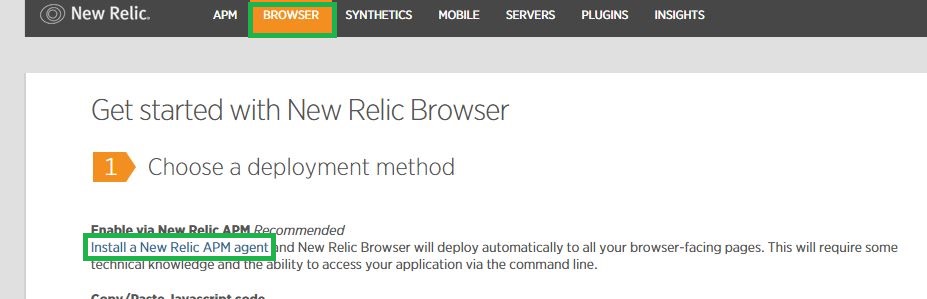
New Relic Java agent
-
Select “Java” and then Download the Java agent mentioned at step 2.
-
Unzip the downloaded file and copy the newrelic folder to your wwwroot folder or any folder within your application.
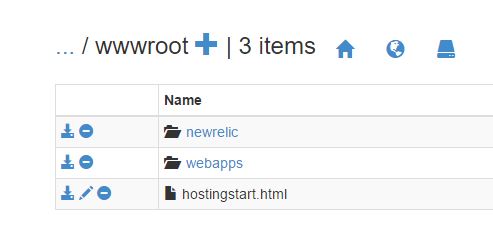 newrelic folder
 -
Add the Application Settings for CATALINA_OPTS in your webapp on Azure Portal with value as -Djavaagent:”D:\home\site\wwwroot\newrelic\newrelic.jar”. Make sure you modify the path accordingly. Note - Please add the letter “D” before javaagent only if you are using Tomcat 8 or earlier. For Tomcat 8.5 onwards, don’t use the letter “D” before javaagent.
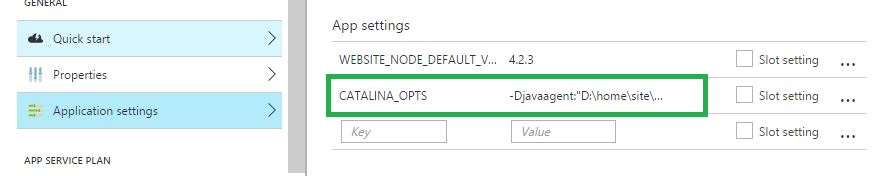
App Setting for Catalina options
-
Once your website is accessed, you should see the JVM listed on your New Relic Dashboard.
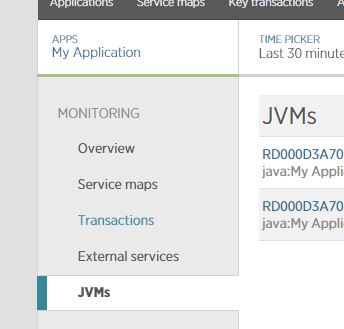
New Relic Dashboard with JVMs info
-
Using the Profile JVM link, you can profile your Java process and take thread dumps.
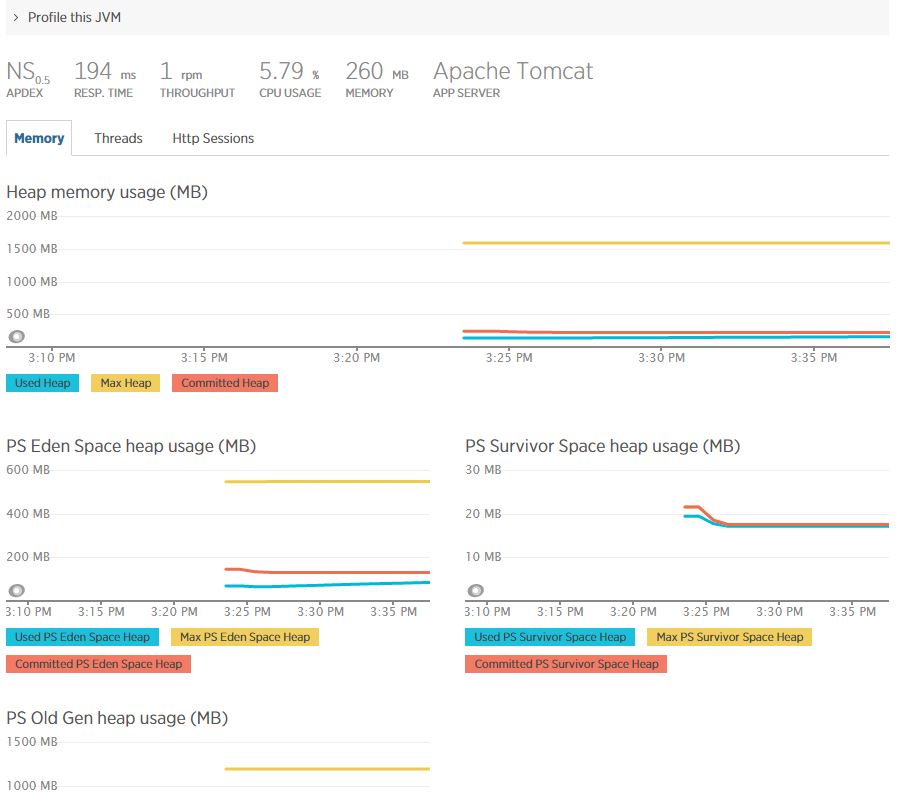 JVM Information
Sample Profiled data
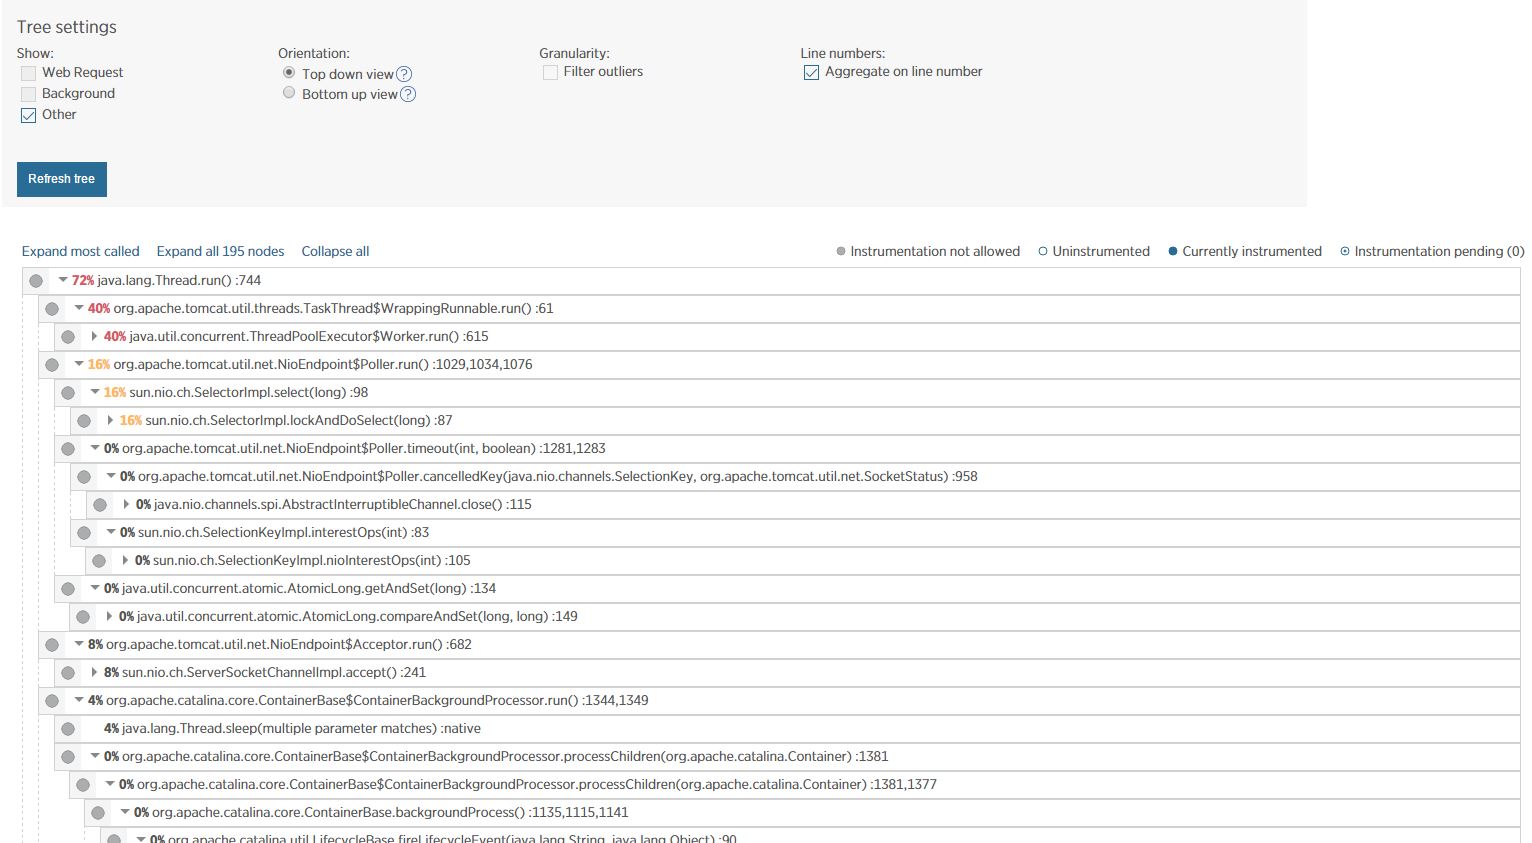
Tree View for Profiled data Hope this helps you debugging issues with your webapp!


