Troubleshooting Node.js High CPU and Memory scenarios in App Service Windows
When dealing with High CPU/Memory scenarios in App Service Windows, the best recommendation is to profile your app in your local environment, but sometimes it is hard to reproduce the issue specially not having the same request load or environment. For those scenarios you can configure a Node.js profiler for your application. There are some third-party libraries that are not compatible when installating due of the Azure App Service Windows’s platform (ia32), in those scenarios you will need to build the packages based on that platform, review this thread for further reference. Here is a list of tools you can use instead:
High CPU
node –prof
Node.js V8 built-in profiler. The built-in profiler uses the profiler inside V8 which samples the stack at regular intervals during program execution. It records the results of these samples, along with important optimization events such as jit compiles, as a series of ticks. This is mostly useful just for CPU traces.
-
Configuration. To enable the profiler just add the
--profflag as followed:node --prof server.jsSince Azure App Service Windows uses IIS as the main http web server and iisnode (native IIS module) that allow hosting your node.js applications, you can use an
iisnode.ymlfile orweb.configto configure this profiler. You need to save any of these files underc:\home\site\wwwroot\ord:\home\site\wwwroot\(In any scenario that applies to you)- Using iisnode.yml:
nodeProcessCommandLine: node --prof server.js -
Using web.config:
<?xml version="1.0" encoding="utf-8"?>
<!--
    This configuration file is required if iisnode is used to run node processes behind
    IIS or IIS Express.  For more information, visit:

    https://github.com/tjanczuk/iisnode/blob/master/src/samples/configuration/web.config
-->

<configuration>
  <system.webServer>
    <!-- Visit http://blogs.msdn.com/b/windowsazure/archive/2013/11/14/introduction-to-websockets-on-windows-azure-web-sites.aspx for more information on WebSocket support -->
    <webSocket enabled="false" />
    <handlers>
      <!-- Indicates that the server.js file is a node.js site to be handled by the iisnode module -->
      <add name="iisnode" path="server.js" verb="*" modules="iisnode"/>
    </handlers>
    <rewrite>
      <rules>
        <!-- Do not interfere with requests for node-inspector debugging -->
        <rule name="NodeInspector" patternSyntax="ECMAScript" stopProcessing="true">
          <match url="^server.js\/debug[\/]?" />
        </rule>

        <!-- First we consider whether the incoming URL matches a physical file in the /public folder -->
        <rule name="StaticContent">
          <action type="Rewrite" url="public{REQUEST_URI}"/>
        </rule>

        <!-- All other URLs are mapped to the node.js site entry point -->
        <rule name="DynamicContent">
          <conditions>
            <add input="{REQUEST_FILENAME}" matchType="IsFile" negate="True"/>
          </conditions>
          <action type="Rewrite" url="server.js"/>
        </rule>
      </rules>
    </rewrite>

    <security>
      <requestFiltering>
        <hiddenSegments>
          <remove segment="bin"/>
        </hiddenSegments>
      </requestFiltering>
    </security>

    <httpErrors existingResponse="PassThrough" />

    <iisnode nodeProcessCommandLine="node --prof server.js"/>

  </system.webServer>
</configuration>
This will create new file
isolate-0xnnnnnnnnnnnn-v8.logfor every new process. - Using iisnode.yml:
- Reproduce the issue and after you are done you will need to restart your site or kill the process to release the file for download.
- Download the file from Kudu site using CMD
https://<sitename>.scm.azurewebsites.net/DebugConsoleor using vfshttps://<sitename>.scm.azurewebsites.net/api/vfs/site/wwwroot/. -
Process the v8 log. To make sense of this file, you need to use the tick processor bundled with the Node.js binary. To run the processor, use the
--prof-processflag or you can use a flamegraph to visualize and explore performance profiling results.-
Using –prof-process:
Running the following command:
node --prof-process isolate-0xnnnnnnnnnnnn-v8.log > processed.txtOutput:
[JavaScript]: ticks total nonlib name 811 8.7% 100.0% LazyCompile: *fibonacci D:\home\site\wwwroot\server.js:14:19 [C++]: ticks total nonlib name [Summary]: ticks total nonlib name 811 8.7% 100.0% JavaScript 0 0.0% 0.0% C++ 267 2.9% 32.9% GC 8547 91.3% Shared libraries -
Using flamegraphs:
-
- You can convert the v8 log file into a json that can be imported into speedscope:
node --prof-process --preprocess -j isolate*.log > profile.v8log.json - Then you can use online version or the offline method installing the library:
npm install -g speedscope - Call speedscope directly with:
speedscope /path/to/profile.v8log.json
Or you can also pipe the output of
node --prof-processdirectly to speedscope with a trailing-like this:node --prof-process --preprocess -j isolate*.log | speedscope -Output:
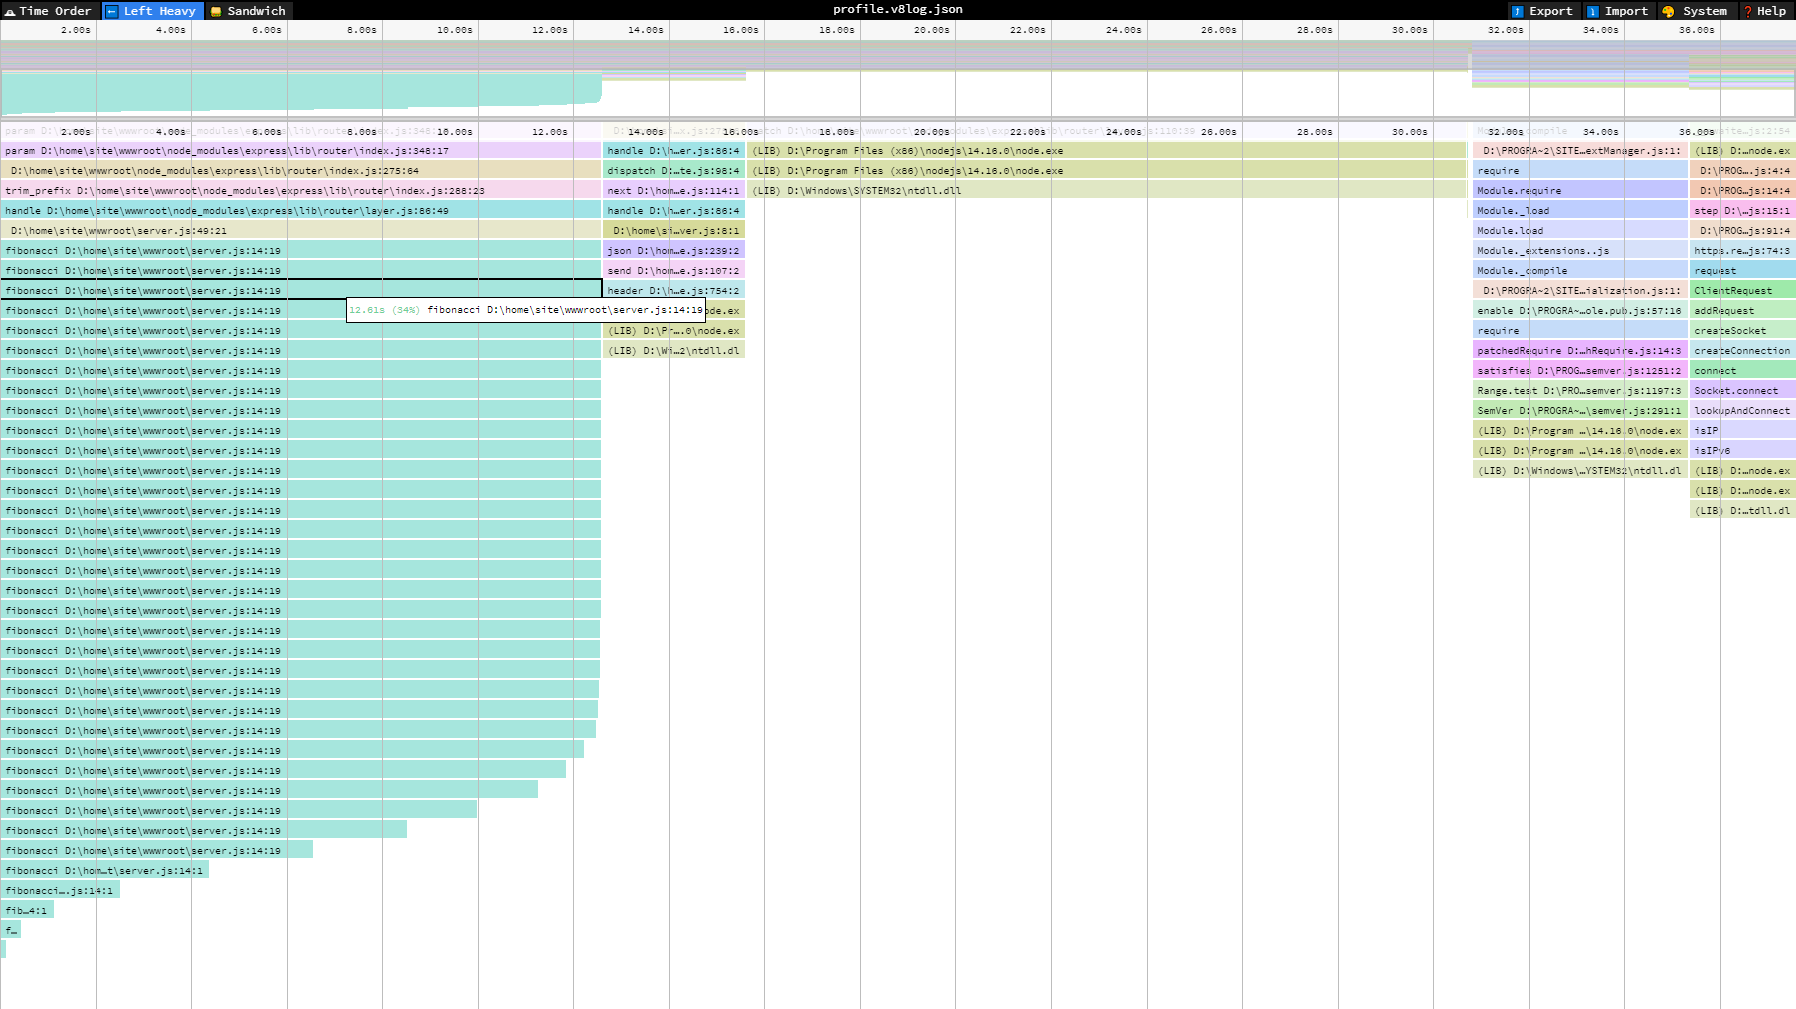
- You can convert the v8 log file into a json that can be imported into speedscope:
-
- You can use the online version or offline method installing the library:
npm install -g flamebearer- Then pipe the output of node –prof-process directly to flamebearer with a trailing - like this:
node --prof-process --preprocess -j isolate*.log | flamebearer -Output:

-
-
node –cpu-prof
Node.js V8 Built-in Profiler. You can run a V8 CPU profiler on startup and writes the CPU profile to disk before exit.
Important: This flag was incorporated in Node.js >=12 versions.
To configure this profiler, you need the following steps:
-
Use iisnode.yml or web.config.
- With iisnode.yml:
nodeProcessCommandLine: node --cpu-prof server.js - With web.config:
  <!--In case you want to omit iisnode.yml and just add the parameter in web.config-->
  <iisnode nodeProcessCommandLine="node --cpu-prof server.js"/>
- With iisnode.yml:
-
Since this flag just generates the file when nodejs process exits, then restarting or killing the process from Process Explorer will not work. You will need to implement a process.exit(0) in code using an endpoint to end the process, as an example using express:
app.get('/end', function(req, res){ process.exit(0); }) -
After reproducing the issue, then call this endpoint to exit nodejs process. A new file will be generated having this syntax
CPU.${yyyymmdd}.${hhmmss}.${pid}.${tid}.${seq}.cpuprofile.There are other parameters that you can pass within this flag as if you want to change the name, directory and interval:
- –cpu-prof-dir: Specify the directory where the CPU profiles generated by –cpu-prof will be placed. The default value is controlled by the –diagnostic-dir command-line option.
- –cpu-prof-name: Specify the file name of the CPU profile generated by –cpu-prof.
- –cpu-prof-interval: Specify the sampling interval in microseconds for the CPU profiles generated by –cpu-prof. The default is 1000 microseconds.
As an example in iisnode.yml:
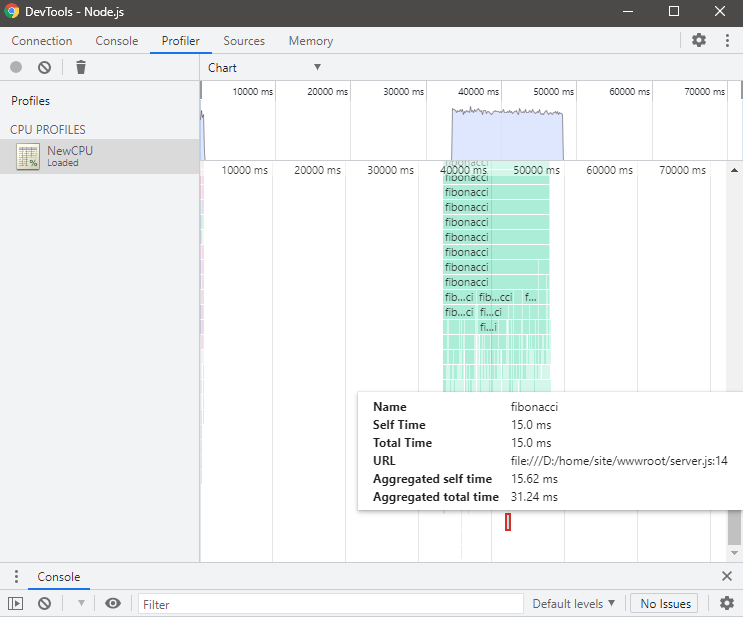
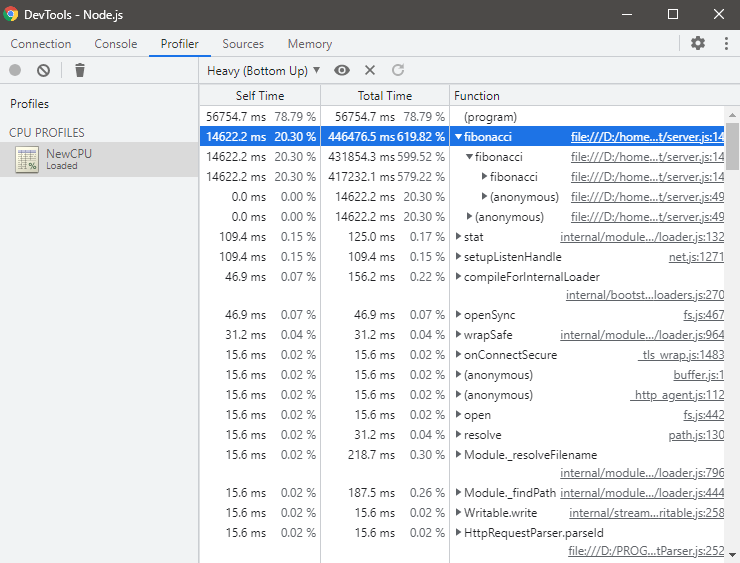
node --cpu-prof-dir "d:/home/LogFiles/" --cpu-prof-name "NewCPU.cpuprofile" --cpu-prof server.js - You can download the *.cpuprofile generated file and use Chrome/Edge to analyze it.
You can type in Chrome browser
chrome://inspect/or with Edgeedge://inspect, and then click onOpen dedicated DevTools for Node. -
Select
Profilertab and load the *.cpuprofile file.And use different views as Chart, Heavy (Bottom up) or Tree.
High Memory
node –heap-prof
Node.js V8 Built-in Profiler. You can run a V8 heap profiler on startup and writes the heap profile to disk before exit.
Important: This flag was incorporated in Node.js >=12 versions.
To configure this profiler you need the following steps:
-
Use iisnode.yml or web.config.
- With iisnode.yml:
nodeProcessCommandLine: node --heap-prof server.js - With web.config:
  <!--In case you want to omit iisnode.yml and just add the parameter in web.config-->
  <iisnode nodeProcessCommandLine="node --heap-prof server.js"/>
- With iisnode.yml:
- Since this flag just generates the file when nodejs process exits, then restarting or killing the process from Process Explorer will not work. You will need to implement a process.exit(0) in your code in specific endpoint if possible like this approach, this is using express:
app.get('/end', function(req, res){ process.exit(0); }) -
After reproducing the issue, then call this endpoint to exit nodejs process. A new file will be generated having this syntax
Heap.${yyyymmdd}.${hhmmss}.${pid}.${tid}.${seq}.heapprofile.There are other parameters that you can pass within this flag as if you want to change the name, directory and interval:
- –heap-prof-dir: Specify the directory where the heap profiles generated by –heap-prof will be placed. The default value is controlled by the –diagnostic-dir command-line option.
- –heap-prof-name: Specify the file name of the heap profile generated by –heap-prof.
- –heap-prof-interval: Specify the average sampling interval in bytes for the heap profiles generated by –heap-prof. The default is 512 * 1024 bytes.
As an example in iisnode.yml:
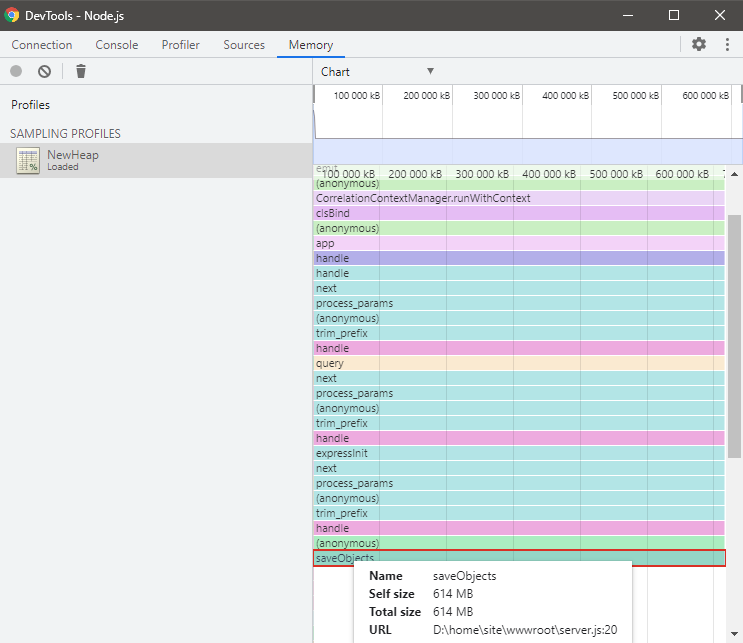
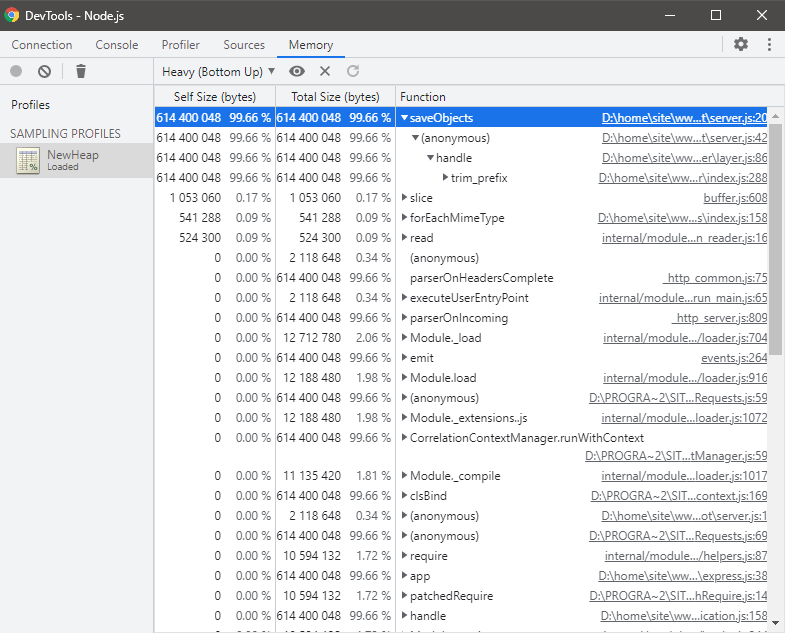
nodeProcessCommandLine: node --heap-prof-dir "d:/home/LogFiles/" --heap-prof-name "NewHeap.heapprofile" --heap-prof server.js - You can download the *.heapprofile generated file and use Chrome/Edge to analyze it.
You can type in Chrome browser
chrome://inspect/or with Edgeedge://inspect, and then click onOpen dedicated DevTools for Node. -
Select
Memorytab and load the *.heapprofile file.And use different views as Chart, Heavy (Bottom up) or Tree.
Node.js process and V8 API
The v8 module exposes APIs that are specific to the version of V8 built into the Node.js binary. Heap functions were added in Node.js v11.13.0 version.
Important: These modules are not considered as profilers but you can take heap snapshots and review for current heap size/spaces values.
v8.getHeapSnapshot()
Node.js API Documentation. Generates a snapshot of the current V8 heap and returns a Readable Stream that may be used to read the JSON serialized representation.
- Print heap snapshot to the console:
const v8 = require('v8'); const stream = v8.getHeapSnapshot(); stream.pipe(process.stdout); - Print heap snapshot to a file:
const v8 = require('v8');
const stream = v8.getHeapSnapshot();
const fileName = `${Date.now()}.heapsnapshot`;
const fileStream = fs.createWriteStream(fileName);
stream.pipe(fileStream);
v8 heap statistics
You can get statistics of the heap with the following methods:
-
v8.getHeapStatistics(). Returns a json object with the following properties:
{ "total_heap_size": 6758400, "total_heap_size_executable": 573440, "total_physical_size": 5343184, "total_available_size": 1850334072, "used_heap_size": 5053976, "heap_size_limit": 1854668800, "malloced_memory": 8192, "peak_malloced_memory": 586304, "does_zap_garbage": 0, "number_of_native_contexts": 1, "number_of_detached_contexts": 0 } -
v8.getHeapSpaceStatistics(). Returns statistics about the V8 heap spaces, i.e. the segments which make up the V8 heap.
[ { "space_name": "read_only_space", "space_size": 151552, "space_used_size": 150392, "space_available_size": 0, "physical_space_size": 150680 }, { "space_name": "new_space", "space_size": 1048576, "space_used_size": 110312, "space_available_size": 937112, "physical_space_size": 111464 }, { "space_name": "old_space", "space_size": 4087808, "space_used_size": 3964560, "space_available_size": 93944, "physical_space_size": 3973936 }, { "space_name": "code_space", "space_size": 360448, "space_used_size": 120192, "space_available_size": 5376, "physical_space_size": 141568 }, { "space_name": "map_space", "space_size": 528384, "space_used_size": 306000, "space_available_size": 216056, "physical_space_size": 497736 }, { "space_name": "large_object_space", "space_size": 532480, "space_used_size": 524344, "space_available_size": 0, "physical_space_size": 532480 }, { "space_name": "code_large_object_space", "space_size": 49152, "space_used_size": 2880, "space_available_size": 0, "physical_space_size": 49152 }, { "space_name": "new_large_object_space", "space_size": 0, "space_used_size": 0, "space_available_size": 1047424, "physical_space_size": 0 } ] -
process.memoryUsage(). Returns an object describing the memory usage of the Node.js process measured in bytes.
const memory= process.memoryUsage();
rss: Math.round(memory['rss'] / 1024 / 1024 * 100) / 100, //Resident set size (RSS) is the portion of memory occupied by a process that is held in main memory (RAM)
heapTotal:Math.round(memory['heapTotal'] / 1024 / 1024 * 100) / 100, //Total Size of the Heap
heapUsed:Math.round(memory['heapUsed'] / 1024 / 1024 * 100) / 100, //Heap actually Used
external:Math.round(memory['external'] / 1024 / 1024 * 100) / 100,

{
  "rss": "36.62 MB",
  "heapTotal": "6.45 MB",
  "heapUsed": "5.45 MB",
  "external": "1.39 MB",
  "memory_raw": {
    "rss": 38400000,
    "heapTotal": 6758400,
    "heapUsed": 5720176,
    "external": 1458382,
    "arrayBuffers": 26810
    }
}
For troubleshooting these scenarios in Azure App Service Linux follow the next references:


