Diagnostic Tools for Java Performace on App Service Windows
When dealing with High CPU, High Memory, or general performance scenarios on App Service Windows, it’s recommended to profile the application locally, but this may not always be possible nor reflect the same results. This may be due to the difference in load or environment configuration.
App Service Windows has various ways to collect traces & this article will walk through options avaliable to run Java diagnostic tools.
Automated Collection via Diagnose and Solve Problems
Opposed to manually executing commands through the Kudu Console, the “Diagnose & Solve Problems” blade allows us to run jstack, jmap or jfr against any targeted instance with just a few clicks.
- Diagnose and Solve Problems > Diagnostic Tools > Collect Java…
- Java Memory Dump, Java Thread Dump, Java Flight Recorder Trace
Automated Collection via Auto Heal
Auto-Heal provides you with an easy way to take action when your app is exhibiting any unexpected behavior. Conditions can be setup to trigger either a Heap dump or a Thread Dump programmatically.
- Diagnose and Solve Problems > Diagnostic Tools > Auto-Heal > Choose Condition > Choose Custom Action > Java…
- Java Memory Dump, Java Thread Dump
Manual Collection via Kudu
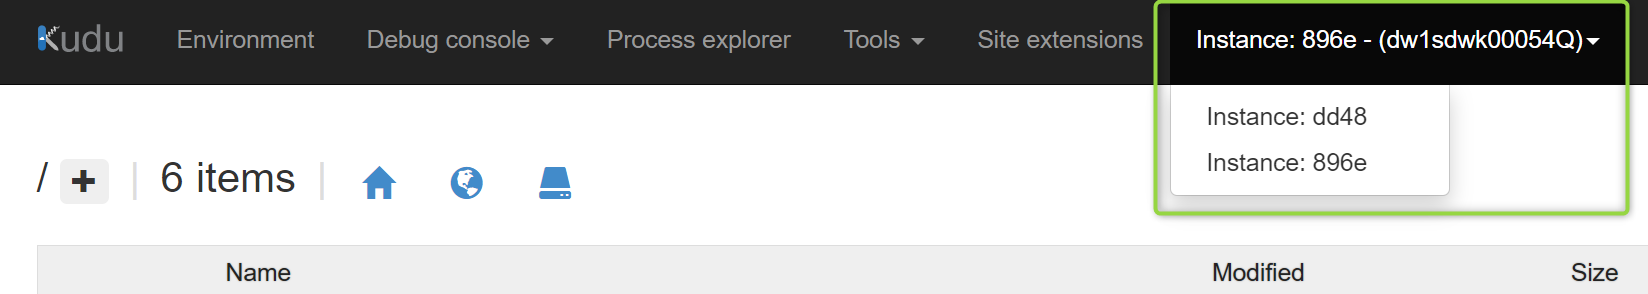
You can select which instance you’d like to console into if scaled out to multiple instances before collecting your trace. This is helpful if a performance issue has been narrowed down to a particular instance.
Heap Dumps - High Memory
Heaps dumps provide us with a snapshot of all the heaps live objects in use at a specific moment which is useful when troubleshooting memory leaks or understanding resource constraints.
- Detemine the PID using the Kudu Process Explorer.
https://<web-app-name>.scm.azurewebsites.net/ProcessExplorer/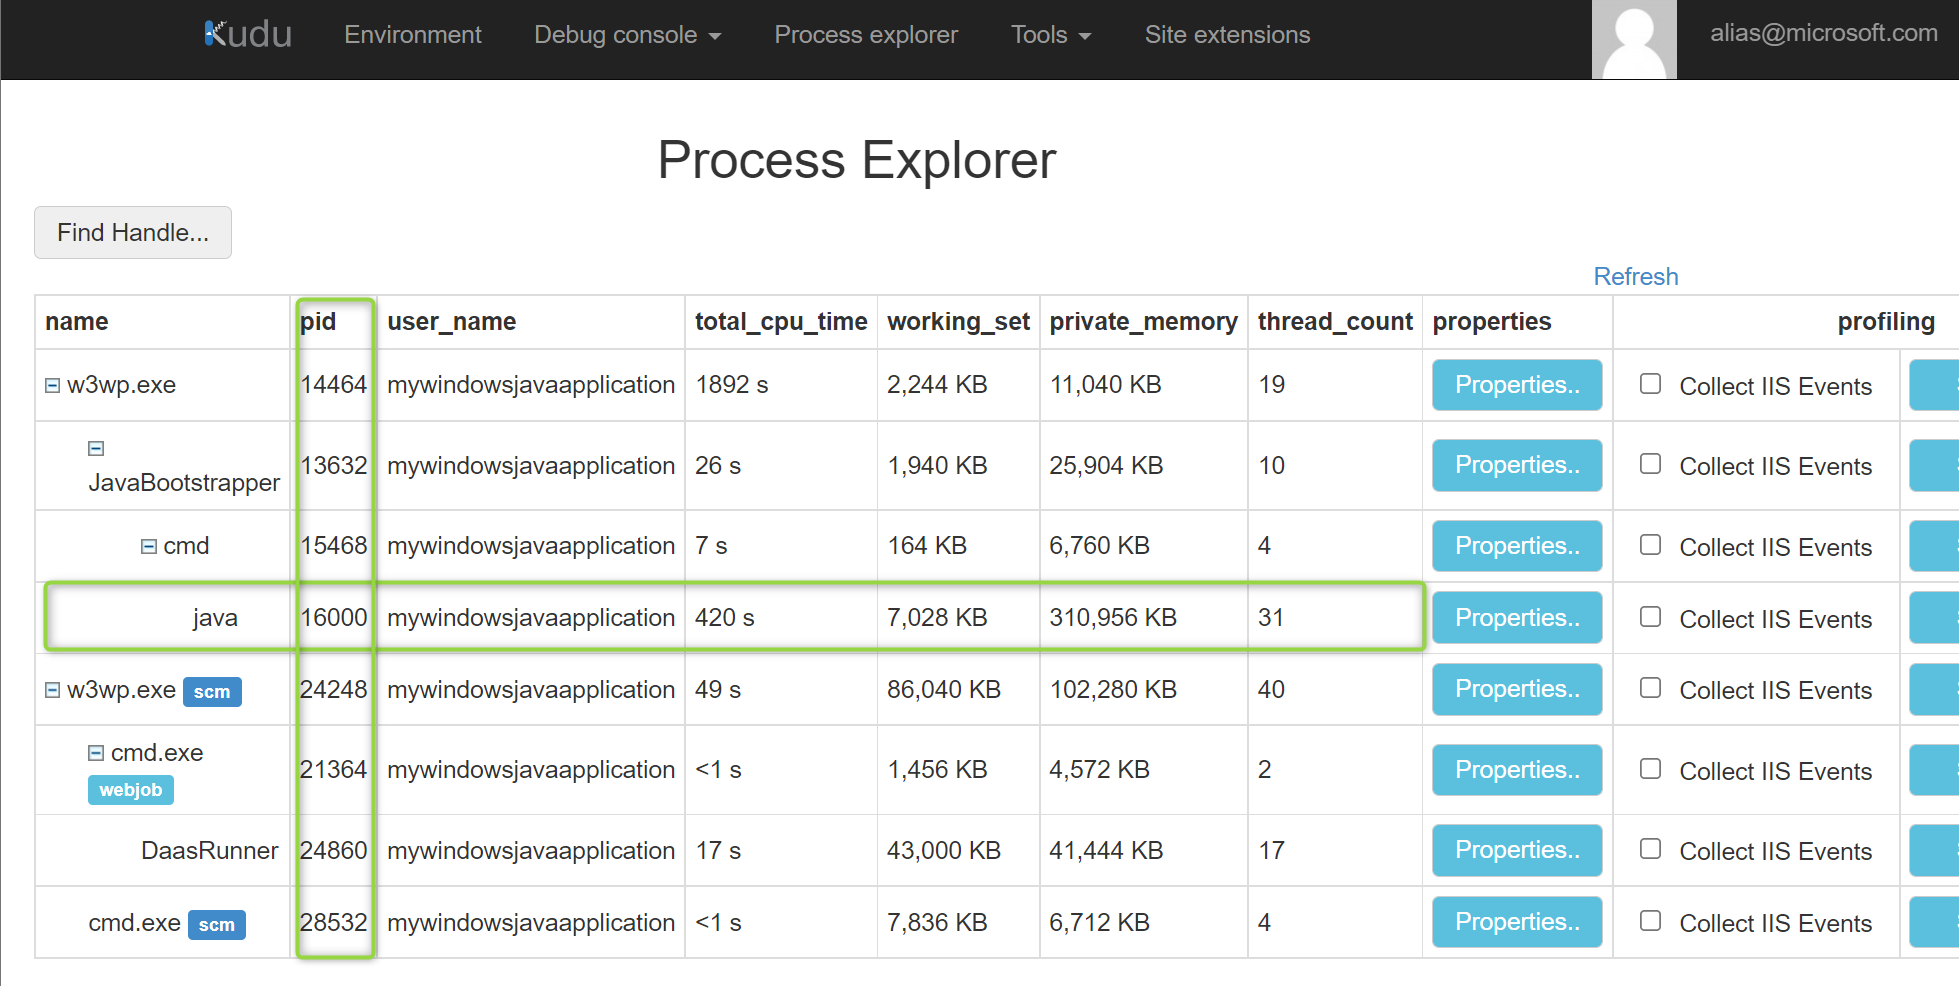
-
Collect your heap dump using jmap.
jmap.exe -dump:format=b,file=C:\home\LogFiles\dump.hprof <javapid># Example Output C:\home>jmap.exe -dump:format=b,file= C:\home\LogFiles\dump hprof 16000 Heap dump file created -
The dump file will be created at C:\home\LogFiles\dump.hprof & can be easily downloaded from the filesystem using the Kudu Debug Console, File Explorer.
https://<webapp-name>.scm.azurewebsites.net/DebugConsole -
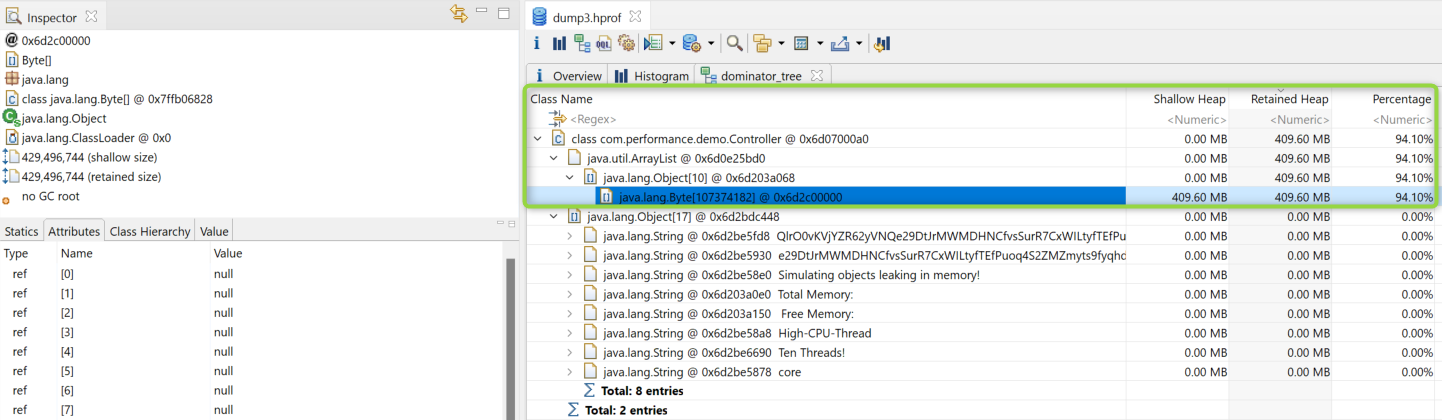
Eclipse Memory Analyzer can then be downloaded locally to analyze heap dumps. Below we can see the dominator tree of a heap dump showing the objects of my retained heap.
Thread Dumps - High CPU
Thread dumps provide us with a snapshot of all the threads executing at a specific moment. This includes information like the state of the threads, stack trace associated & reference addresses. We’ll be using jStack to collect our thread dumps which can help us identify any blocked threads or running threads.
It’s a best practice to collect at least three dumps. Each dump should be taken within 10 second intervals to account for thread state changes.
- Detemine the PID using the Kudu Process Explorer.
https://<web-app-name>.scm.azurewebsites.net/ProcessExplorer/ -
Collect your thread dump using jstack.
jstack.exe <javapid> > C:/home/LogFiles/threaddump.txt# Example Output C:\home>jstack.exe 16000 > C:/home/site/threaddump.txt C:\home> -
The thread dump will be created at C:/home/site/threaddump.txt & can be easily downloaded from the filesystem using the Kudu Debug Console, File Explorer.
https://<webapp-name>.scm.azurewebsites.net/DebugConsole -
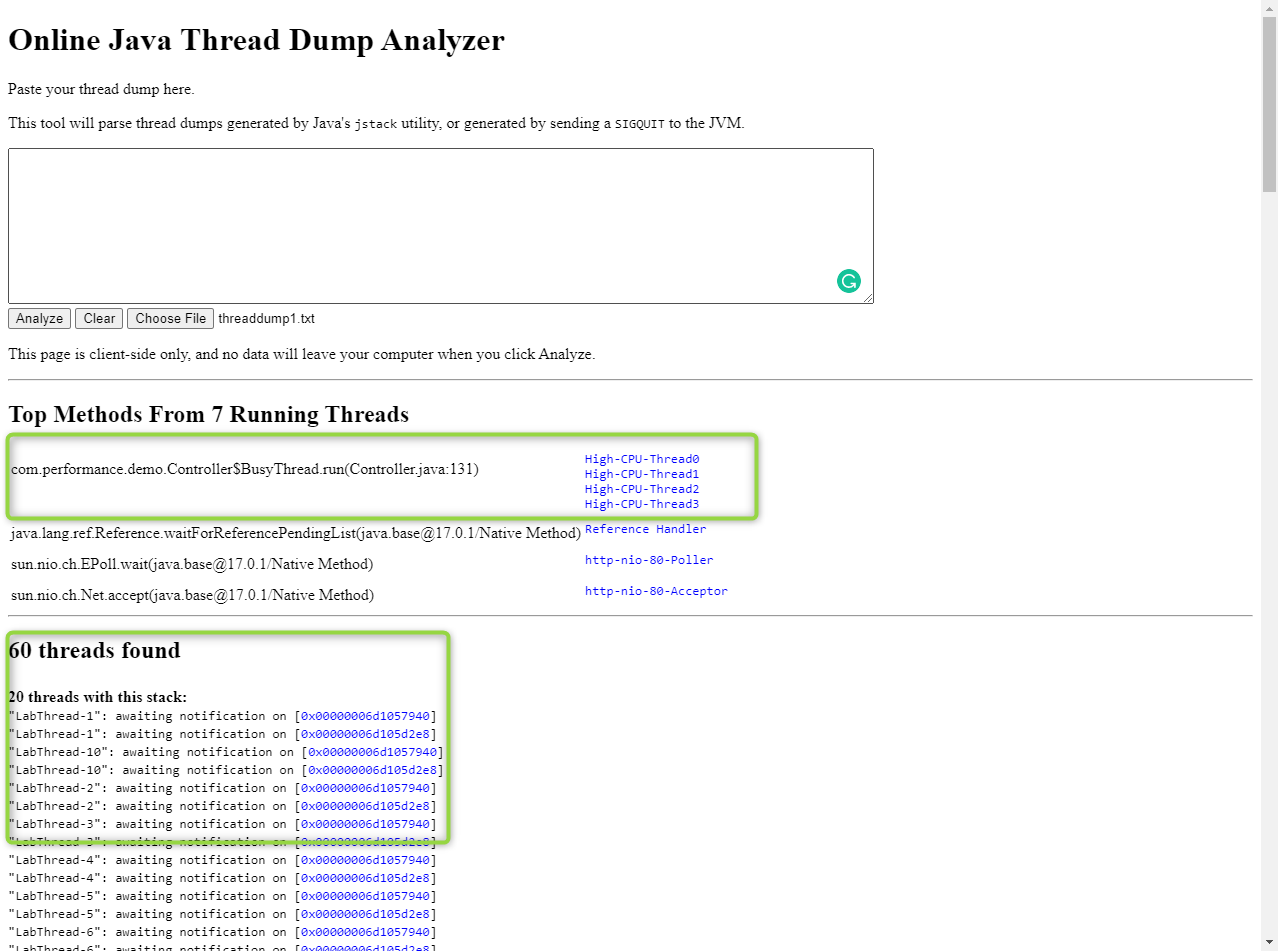
Thread Dumps can be reviewed manually or with any of the thread analyzers mentioned below. At the same time, thread dumps contain application data, and local or client-side analyzers can be used to avoid leaking any potentially sensitive information.
- Spotify Thread Analyzer - https://spotify.github.io/threaddump-analyzer – Client Side
- FastThread - Smart Java thread dump analyzer - thread dump analysis in seconds – Server Side
- Samurai Tread Dump Analysis Tool - Local
Java Flight Recorder - Profiling
Java Flight Recorder (JFR) is a monitoring tool that collects information about the events in a Java Virtual Machine (JVM) while the application is running.
JFR is designed to have minimal perforamce impact & continuously saves large amounts of data about the running system. This profiling information includes thread samples (which show where the program spends its time), lock profiles, and garbage collection details.
Depending on the scenario & if the issue is reproducible, recordings can be manually started or run continuously at startup.
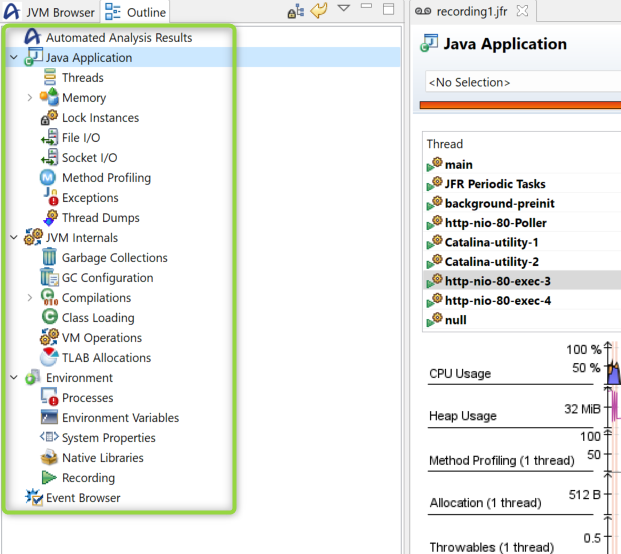
Flight Recordings can be reviewed using Zulu Mission Control
Timed Recordings
- Determine the PID using the Kudu Process Explorer.
https://<web-app-name>.scm.azurewebsites.net/ProcessExplorer/ -
Execute the command below to start a 300-second recording of the JVM. This will profile the JVM and create a JFR file named jfr_example.jfr in
C:\home\LogFiles\. Additional JFR parametersjcmd <pid> JFR.start name=TimedRecording settings=profile duration=300s filename="C:\home\LogFiles\timed_recording_example.JFR"# Example Output C:\home\site>jcmd 16000 JFR.start name=TimedRecording settings=profile duration=30s filename="C:\home\LogFiles\timed_recording_example.JFR" 16000: Started recording 2. The result will be written to: C:\home\timed_recording_example.JFR -
Flight Recordings will be created at C:\home\LogFiles & can be easily downloaded from the filesystem using the Kudu Debug Console, File Explorer.
https://<webapp-name>.scm.azurewebsites.net/DebugConsole
Continuous Recordings
-
Update your application’s App Setting to pass the flight recording arguments to the JVM. This will start a continuous recording that will start a flight recording at JVM startup that will exit after one day or if the size reaches 1024MB. Additional JFR parameters
JAVA_OPTS=-XX:StartFlightRecording=disk=true,name=continuous_recording,dumponexit=true,maxsize=1024m,maxage=1d -
The continuous recording can also be manually stopped with the following command. Note: The name parameter specified must match was is passed in the JAVA_OPTS to stop the JFR.
jcmd <pid> JFR.dump name=continuous_recording filename="C:\home\LogFiles\manuallystopped_recording1.jfr"# Example Output C:\home\site>jcmd 16000 JFR.dump name=continuous_recording filename="C:\home\LogFiles\manuallystopped_recording1.jfr" 16000: Dumped recording "continuous_recording", 2425.0 kB written to: C:\home\LogFiles\manuallystopped_recording1.jfr -
Flight Recordings will be created at /home/LogFiles/recording1.jfr & can be easily downloaded from the filesystem using the Kudu Debug Console, File Explorer. JFRs can be reviewed using Zulu Mission Control.
https://<webapp-name>.scm.azurewebsites.net/DebugConsole


