Troubleshooting Common iisnode Issues
Azure provides built-in diagnostics to assist in debugging node applications hosted on Azure App Service Windows. This article will cover how to enable logging of stdout/stderr and use diagnostic tools to troubleshoot common iisnode issues.
Use caution when using troubleshooting steps on your production site. The recommendation is to troubleshoot your app on a non-production setup, for example, your staging slot and when the issue is fixed, swap your staging slot with your production slot.
Enable Logging
Enable logging on the platform
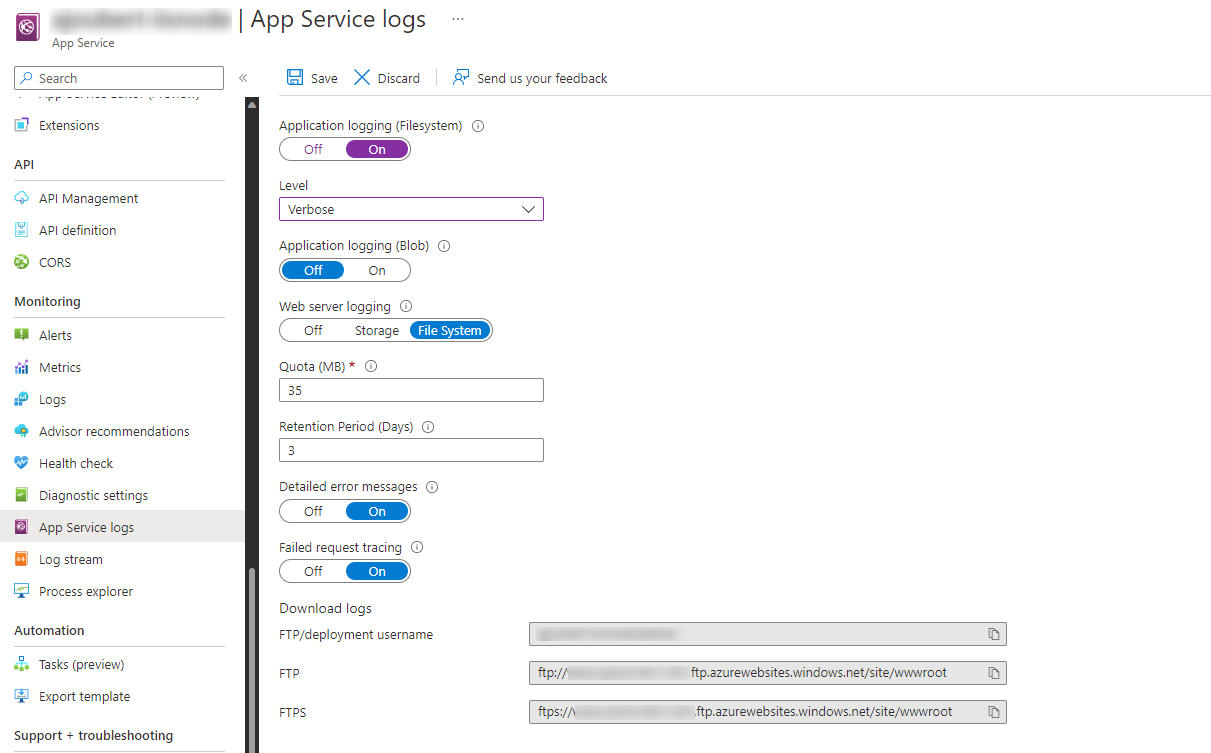
Azure provides built-in diagnostics to assist with debugging an App Service app. For Windows applications, you can enable application logging, web server logging, detailed error messages and failed request tracing.
More details on the above configurations can be found here: https://docs.microsoft.com/en-us/azure/app-service/troubleshoot-diagnostic-logs
Configure application level logging
You can use an iisnode.yml file to control several configuration options for iisnode. If not already created, the file can be placed under the /home/site/wwwroot directory.
We will use the iisnode.yml file for:
- Allowing stdout and stderr streams from node processes to be captured and made available.
- Configure where the files with stdout and stderr captures will be stored.
- Watch error info on the web page (not recommended for production apps).
iisnode.yml:
loggingEnabled: true
logDirectory: /home/logfiles/iisnode
devErrorsEnabled: true
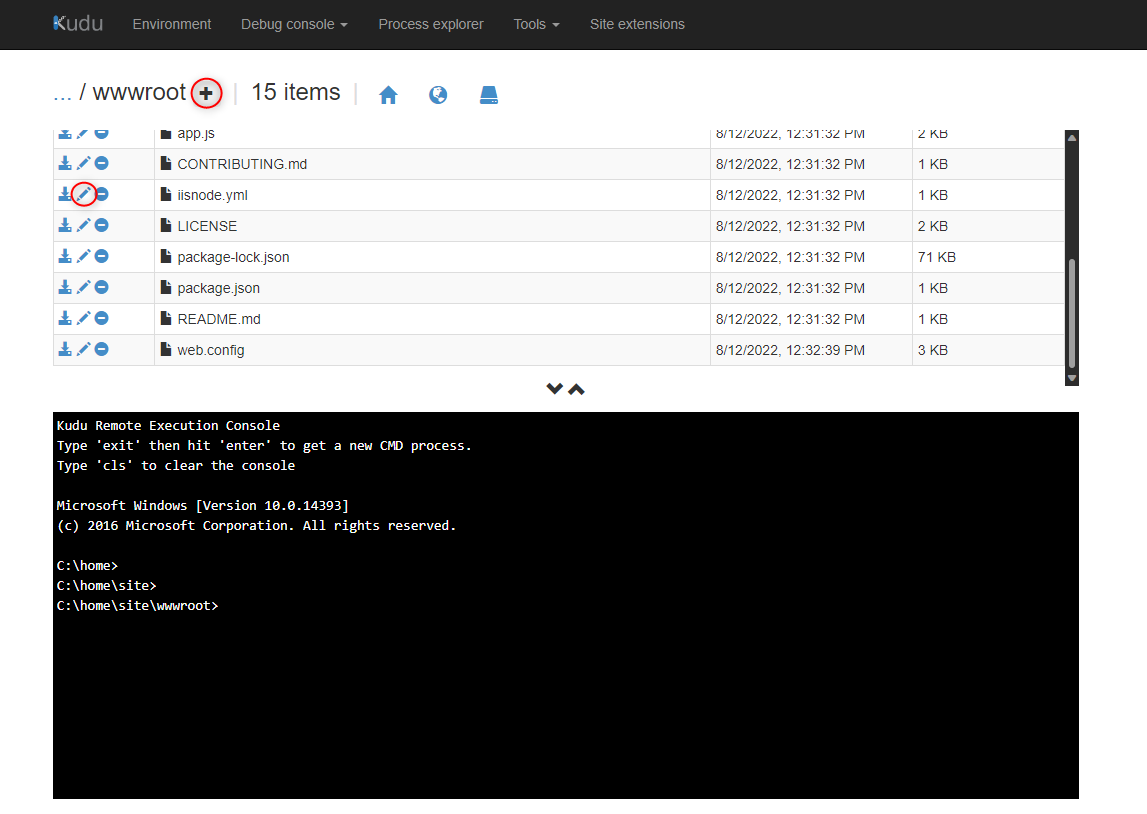
The iisnode.yml file can be created or edited within the Kudu Debug Console. You can access this through Advanced tools in the portal or by editing this URL to include your app name.
web-app-name.scm.azurewebsites.net/DebugConsole
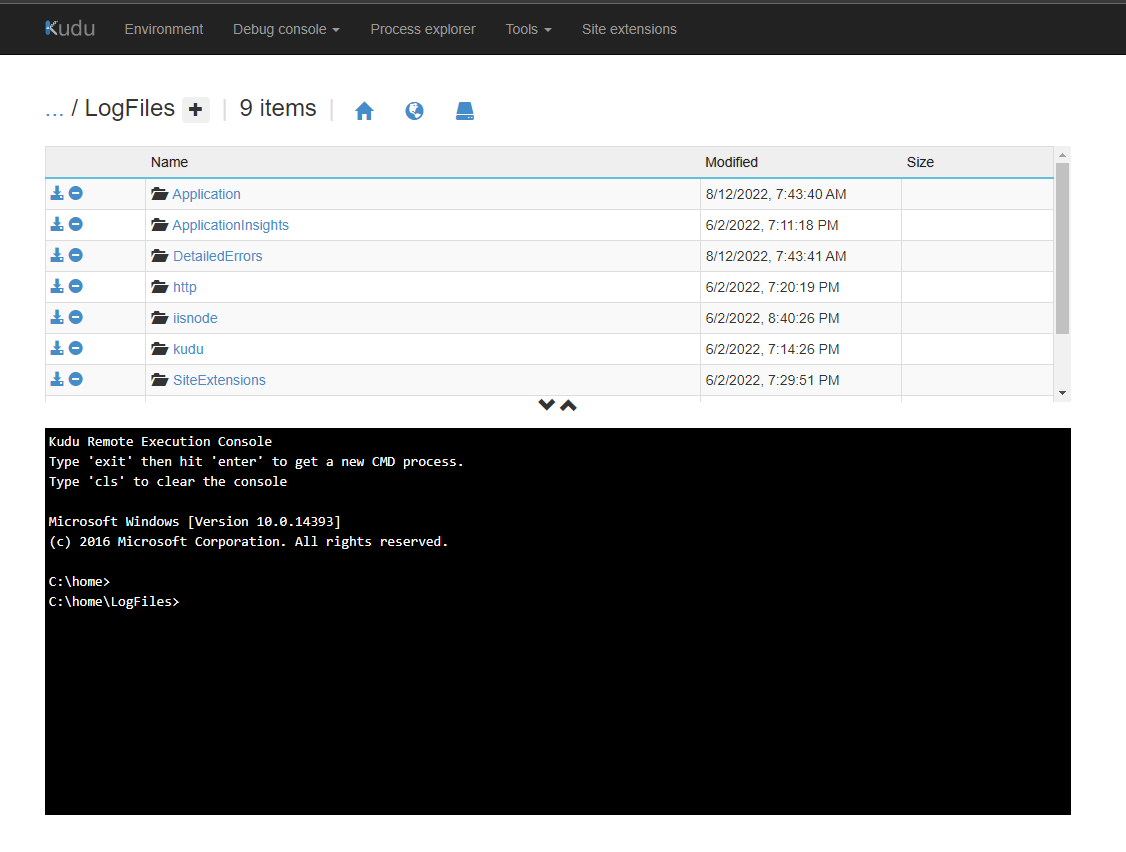
Accessing log files
The contents of the /home/logfiles directory can be downloaded by following: web-app-name.scm.azurewebsites.net/api/zip/logfiles
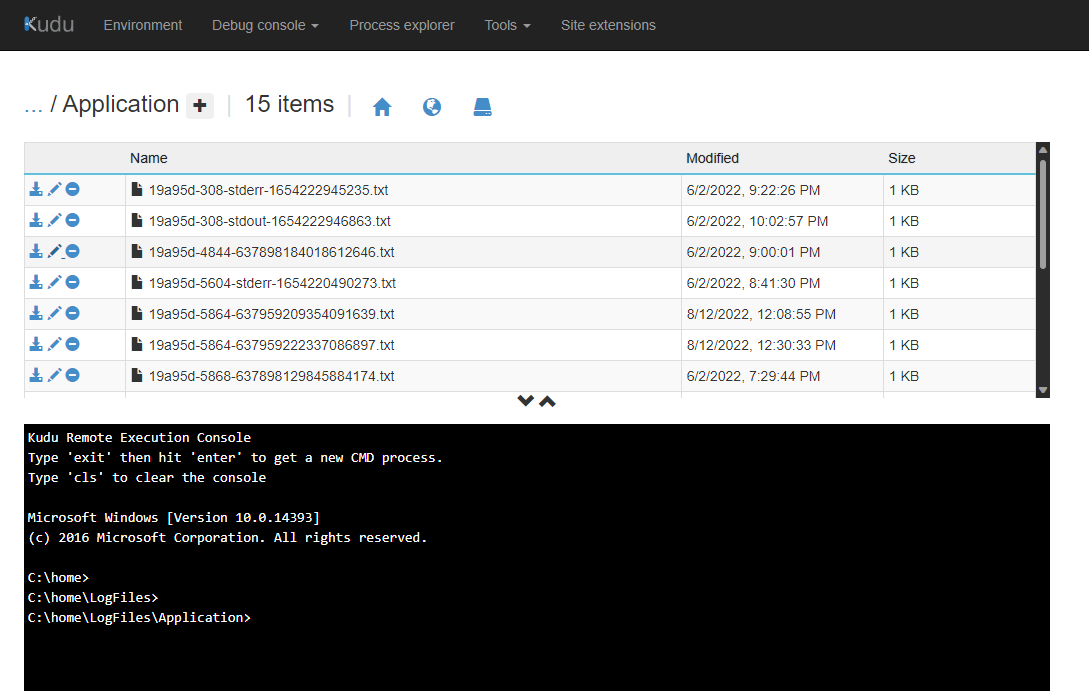
You can also access the log files through the Kudu Debug Console.
Viewing Uncaught Exceptions
All uncaught exceptions are by default written to logging-errors.txt file under \home\LogFiles\Application directory. Note, If you have updated your iisnode.yml file to point to a custom log directory, then logging-errors.txt will be found there.
STDOUT and STDERR
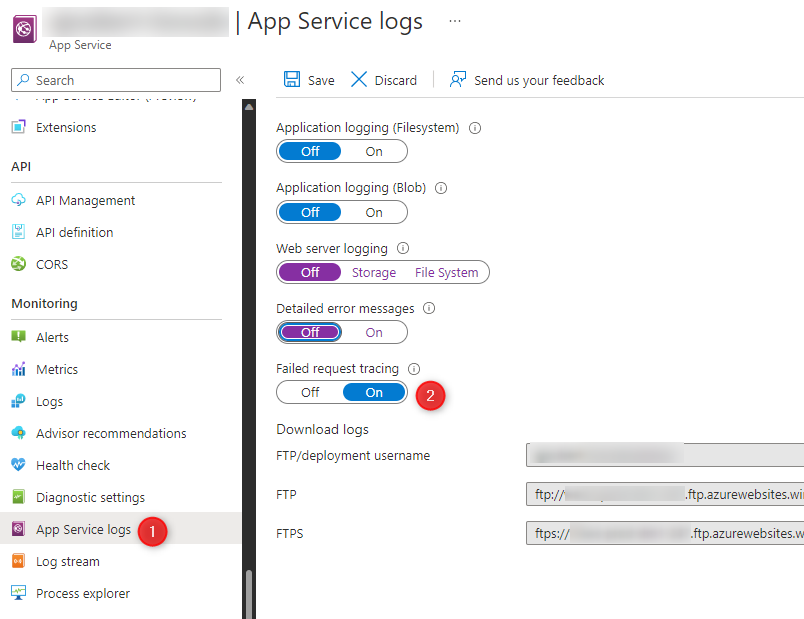
The below screenshot shows how to enable application logging through the portal. This will send STDOUT and STDERR output to the \home\logfiles\application directory.
stdout: console.log(“log content”) - log content will be visible in the XXX-stdout-xxx.txt file under \home\LogFiles\Application directory
stderror: console.error(“error content”) - error content will be visible in the XXX-stderr-xxx.txt file under \home\LogFiles\Application directory
Using Failed request tracing in Azure Web Apps for Windows
-
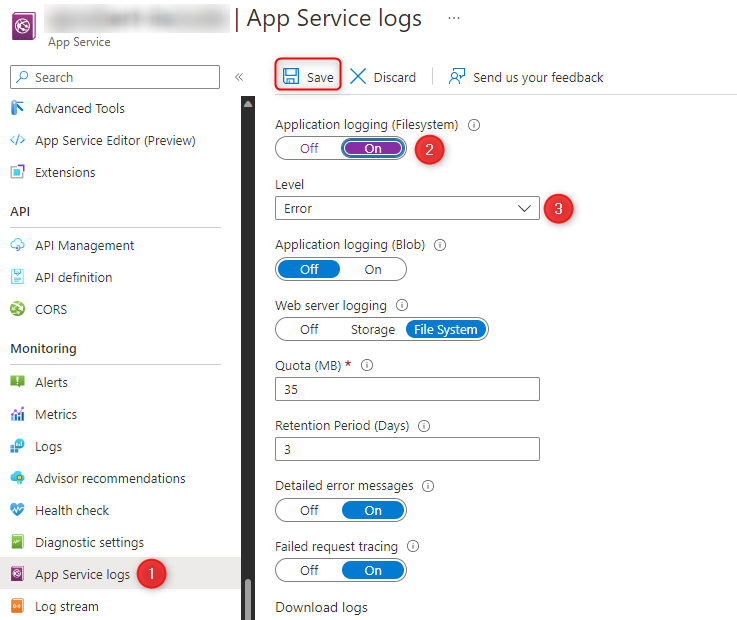
Click on App Service logs under Monitoring settings and Turn On Failed Request Tracing.
-
Another way to enable these logs is through using the Azure CLI with the following command:
az webapp log config --name <sitename> --resource-group <resourcegroupname> --failed-request-tracing true -
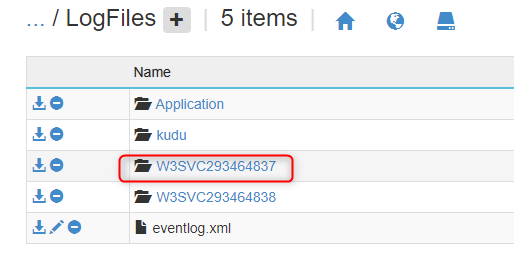
After turning on Failed Request Tracing, new folders(W3SV**) containing failed request logs will be generated under \home\LogFiles and can be accessed through the Kudu console.
Acces the Kudu debug console by following: web-app-name.scm.azurewebsites.net/DebugConsole
-
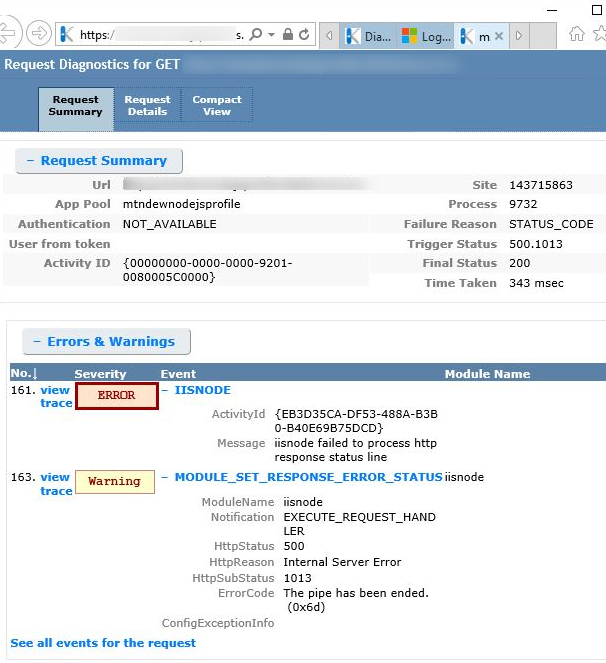
Failed request logs can provide you with more meaningful insight into application errors. You can access the error pages within the browser for easier viewing.
Troubleshooting Common Issues
Hard coding the PORT
If your application does not listen on the correct port, it can result in 500 errors.
Your Node.js app should listen to the port specified in the process.env.PORT variable. The following example shows how you do it in a simple Express app:
const express = require('express')
const app = express()
const port = process.env.PORT || 3000

app.get('/', (req, res) => {
  res.send('Hello World!')
})

app.listen(port, () => {
  console.log(`Example app listening at http://localhost:${port}`)
})
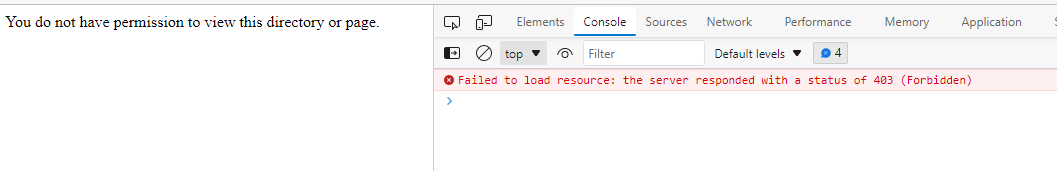
You do not have permission to view this directory or page
The below output typically indicates you are missing a web.config file. When using the App Service Build engine, one will be generated, but if using a service like GitHub Actions, you will need to configure your own web.config. For more information, see:
https://docs.microsoft.com/en-us/azure/app-service/configure-language-nodejs?pivots=platform-windows#you-do-not-have-permission-to-view-this-directory-or-page
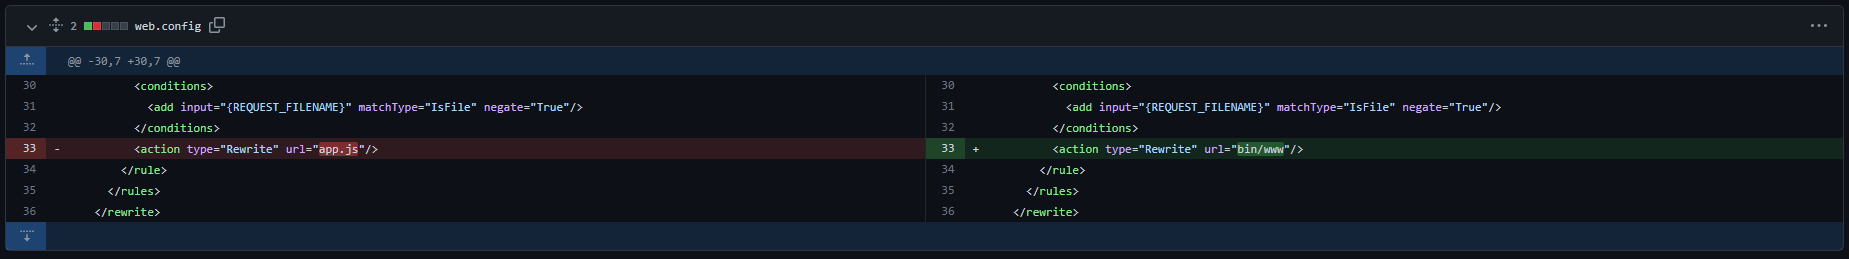
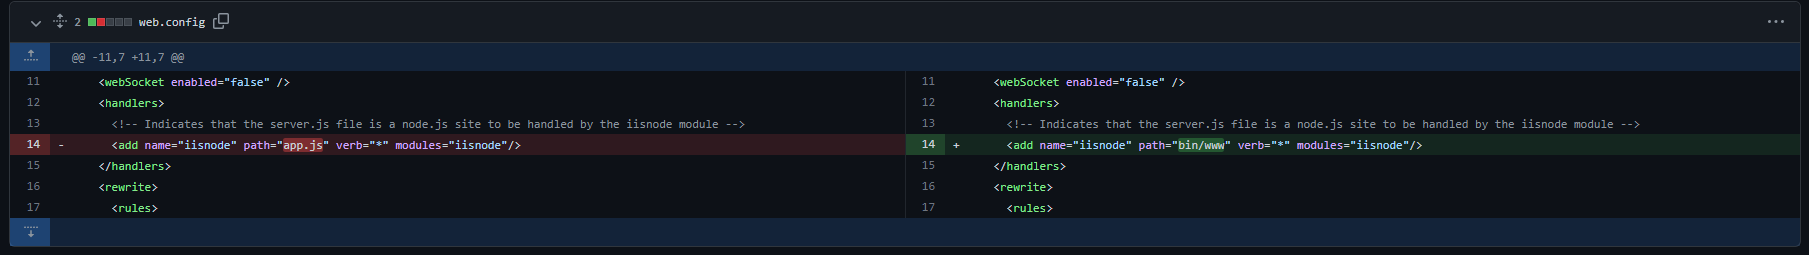
Application code displayed on browser window
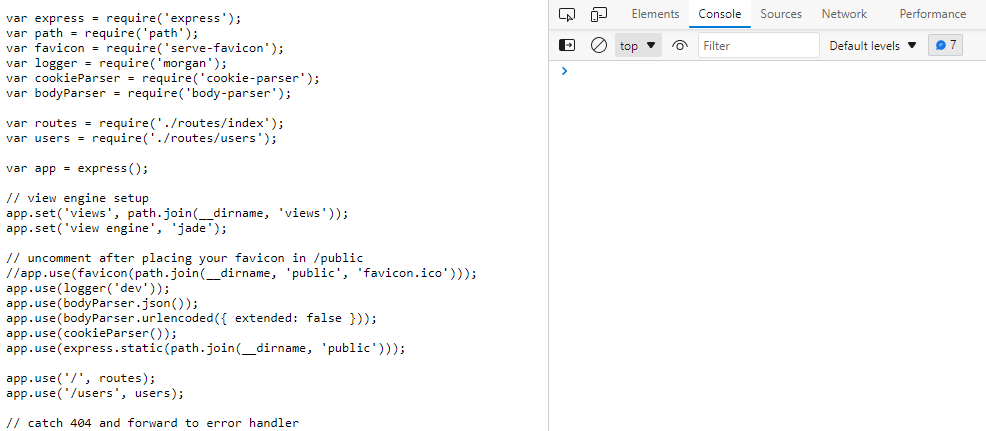
Validate which file is being displayed and check your web.config. In this scenario, the dynamic content rule was misconfigured in the web.config file, and after updating it to /bin/www the expected output was displayed.
Avoid hardcoding Node versions
With PaaS services, such as App Services, the platform underneath is managed for you - therefor over time versions(major, minor, or patch) may be upgraded, removed, or deprecated. Given this, it is best to not hardcode to a specific version within code as this may cause unintended issues down the road.
If either major, minor or patch is removed. This will throw a HTTP 500.1002, but can show other ranges of HTTP 500.1xxx status codes.
When creating a Node.js application, the Node version is reliant upon the value set in WEBSITE_NODE_DEFAULT_VERSION, which is an App Setting created by default. This is only relevant on Windows and Node.js App Services.
The reccomended method is to set the version to the latest minor of the major version found on the instance using the tilda (~) syntax.
WEBSITE_NODE_DEFAULT_VERSION=~16
Be mindful of conflicts between versions set in the iisnode.yml, web.config and WEBSITE_NODE_DEFAULT_VERSION
More inforamtion on this can be found here: Avoiding hardcoding Node versions on App Service Windows
Slow performance observed alongside high CPU usage
The ” nodeProcessCountPerApplication “ setting determines the number of node processes initiated per IIS application. The value is set to 1 by default, launching a single node.exe process. However, you can adjust the value to 0, allowing the launching of node.exes equal to the count of vCPUs on your virtual machine/App Service Plan. For optimal performance in most applications, it is recommended to set the value to 0, enabling the utilization of all available vCPUs on your machine. It’s important to note that node.exe operates on a single thread, meaning each node.exe process utilizes a maximum of 1 vCPU. Therefore, using all vCPUs can help achieve peak node application performance.
/home/site/wwwroot/iisnode.yml:
nodeProcessCountPerApplication: 0
To validate CPU usage, you can review the detectors under the App Service Diagnose and Solve Problems blade.
NPM version conflict
If you run into an issue where you believe the conflict is due to the NPM version, you can test by updating the NPM version using the application setting WEBSITE_NPM_DEFAULT_VERSION=desired-version.
To validate the NPM version being used, you can run the below command within the SCM site debug console found here: webapp-name.scm.azurewebsites.net/DebugConsole
npm --version
To validate which versions of NPM are installed on your App Service plan, you can browse your application’s SCM site and review the runtime versions here: webapp-name.scm.azurewebsites.net/api/diagnostics/runtime
Testing the behaviour locally to validate a conflict with a specific NPM version is best.
IISNODE http status and substatus
The below table is referenced from:
https://docs.microsoft.com/en-us/azure/app-service/app-service-web-nodejs-best-practices-and-troubleshoot-guide#iisnode-http-status-and-substatus
| HTTP Status | HTTP Substatus | Possible reason? |
|---|---|---|
| 500 | 1000 | There was some issue dispatching the request to IISNODE – Check if node.exe was started. Node.exe could have crashed when starting. Check your web.config configuration for errors. |
| 500 | 1001 | - Win32Error 0x2 - App is not responding to the URL. Check the URL rewrite rules or check if your express app has the correct routes defined. - Win32Error 0x6d – named pipe is busy – Node.exe is not accepting requests because the pipe is busy. Check high cpu usage. - Other errors – check if node.exe crashed. |
| 500 | 1002 | Node.exe crashed – check d:\home\LogFiles\logging-errors.txt for stack trace. |
| 500 | 1003 | Pipe configuration Issue – The named pipe configuration is incorrect. |
| 500 | 1004-1018 | There was some error while sending the request or processing the response to/from node.exe. Check if node.exe crashed. check d:\home\LogFiles\logging-errors.txt for stack trace. |
| 503 | 1000 | Not enough memory to allocate more named pipe connections. Check why your app is consuming so much memory. Check maxConcurrentRequestsPerProcess setting value. If it’s not infinite and you have many requests, increase this value to prevent this error. |
| 503 | 1001 | Request could not be dispatched to node.exe because the application is recycling. After the application has recycled, requests should be served normally. |
| 503 | 1002 | Check win32 error code for actual reason – Request could not be dispatched to a node.exe. |
| 503 | 1003 | Named pipe is too Busy – Verify if node.exe is consuming excessive CPU. |
Troubleshooting 5xx Server Errors
If your application is returning a HTTP 500 error, the next place to look is the detailed errors within the /home/LogFiles directory. This will give you the substatus code and win32 error code, which can be used to help isolate the issue further. An example of the detailed error output can be observed in the next section.
HTTP Error 500.50 - URL Rewrite Module Error
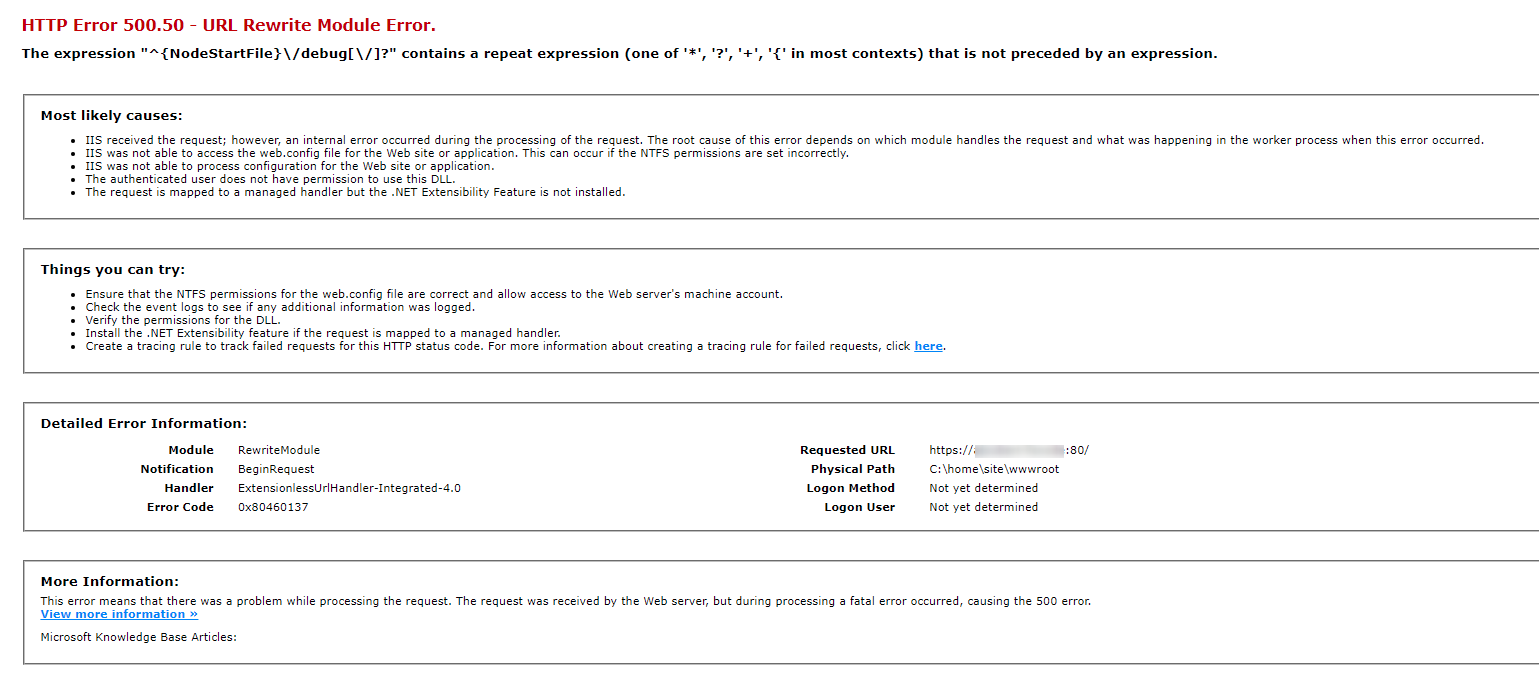
500.50 can indicate a conflict with the web.config. Review your web.config and check:
- There are no duplicate entries.
- You are pointing to the correct path for your Node start file.
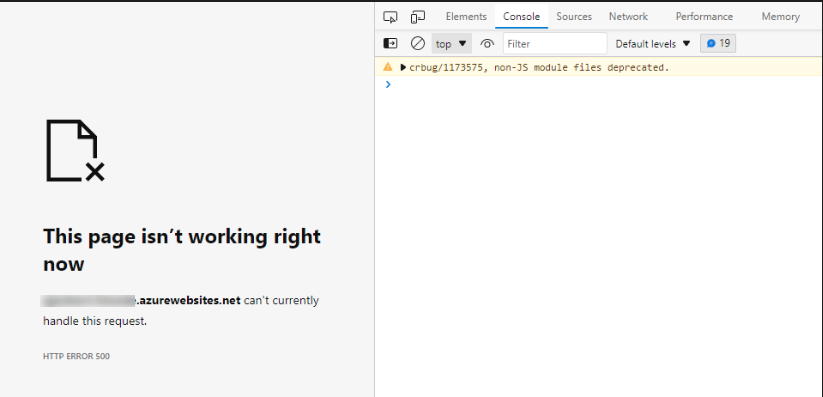
HTTP Error 500.1001 - Internal Server error
As well as the detailed errors view, we will receive the below browser output if we have dev errors enabled within the iisnode.yml file.
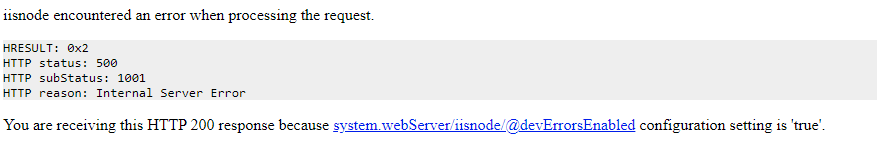
Searching for HResult code 0x2 returns - Win32Error 0x2 - App is not responding to the URL. Check the URL rewrite rules and if your app has the correct routes defined.
The above scenario was resolved after updating the misconfigured handlers within the web.config.
HTTP Error 500.1013 with code Win32ErrorCode: 0x0000006d (IISNODE_ERROR_FAILED_PROCESS_HTTP_STATUS_LINE)
This condition often indicates that the connection between node.exe and iisnode was broken in the middle of the application sending back the HTTP response. This, in turn, may result from an exception during response processing.
Reviewing your response code paths for unhandled exceptions and checking the application logs for further details will be an excellent next step.
All uncaught exceptions are by default written to logging-errors.txt and can be found under \home\logfiles\application or the directory specified in your iisnode.yml.
Suppose the Nodejs process is crashing but not logging anything in the Application Logs. In that case, the application logging will need to be improved to capture the uncaught exceptions before the process crashes.
The below recommendation should only be used for troubleshooting purposes and as a last resort. The correct use of ‘uncaughtException’ is to perform synchronous cleanup of allocated resources (e.g. file descriptors, handles, etc.) before shutting down the process. It is not safe to resume regular operation after ‘uncaughtException’ because the system becomes corrupted.
Using ‘uncaughtException’ correctly
process.on('unhandledRejection', (reason, p) => {
  console.error(reason, 'Unhandled Rejection at Promise', p);
  }).on('uncaughtException', err => {
  console.error(err, 'Uncaught Exception thrown');
   process.exit(1);
});
This scenario can also occur when the application runs out of memory or has a high CPU. You can review memory and CPU usage through the diagnose and solve problems blade.


