Container Apps: Profiling Java applications for performance issues
This post will cover using JDK-based troubleshooting tools to help profile performance issues on Container Apps with Java applications.
Overview
Sometimes, applications may encounter issues due to poor performance - either high CPU usage, high memory (or out of memory), generally slow performance due to code execution logic, or others.
In these scenarios, if it’s been determined this is likely an application problem, you can use JDK based tooling to profile or take dumps of the application.
Important Prerequisites
Some important prerequisites is to be able to:
- Being able to connect to the container through the Console blade or use the
az containerapp execcommand. See console documentation here - Able to download files from the container
- Be able to install the relevant JDK if not already installed.
Console access
You can use either the Azure CLI or the portal for console access. Below is what portal access would look like:
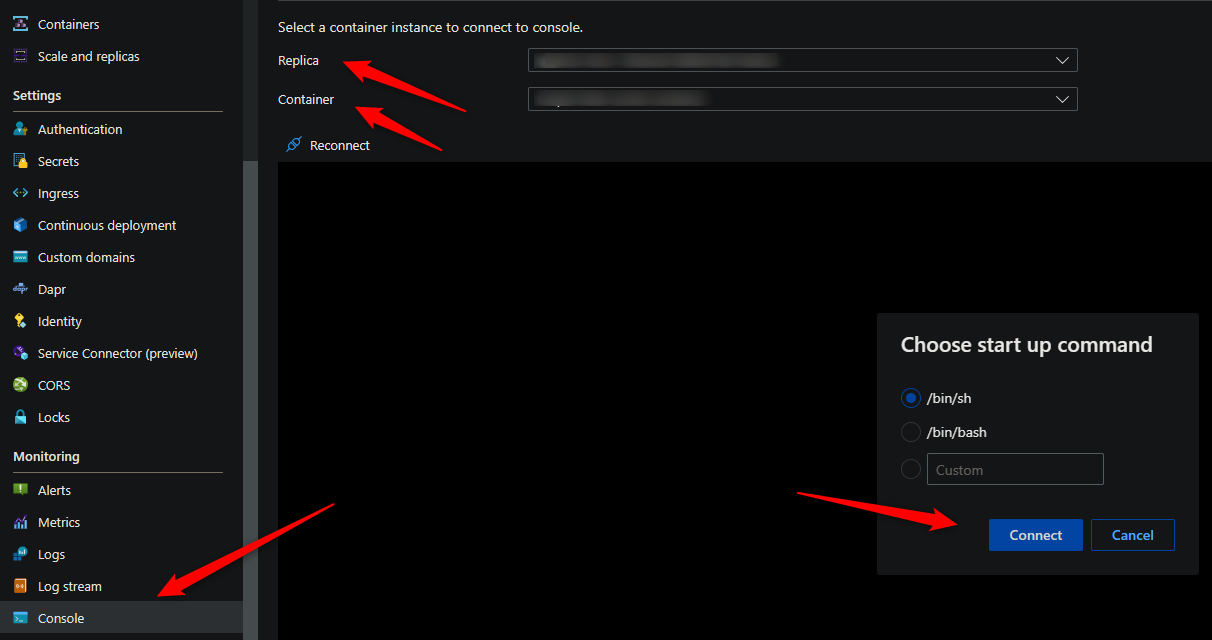
These commands for capturing profiles and dumps require access to a terminal - so console access is required.
Download files from the container
You’ll need a way to download files from the container. By default, there is no way to get files generated at runtime by a container in Container Apps without some additional configuration.
The most simplistic way is to mount a volume from an Azure File Share with an Azure Storage Account.
For a quickstart on how to add a volume, follow Use storage mounts in Azure Container Apps
NOTE: It is advised to add this mount before testing or generating files. If you do this after testing (and in single revision mode, for instance) then a new pod will be created and previous files would be lost.
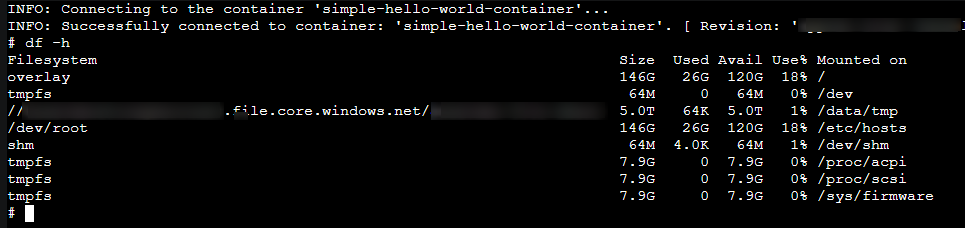
You can validate that the volume is mounted with the df -h command:
Ensure the JDK is installed
A Java application can run with the JDK or JRE. Using a JDK should typically ensure you have performance tooling available, like jstack, jmap, jcmd, or others.
Using a JRE will only contain enough in the image to run the Java application - so “extras” like those tooling will not normally be avaiable in the image.
You can check if your image is using a JDK or JRE by reviewing the image in your Dockerfile - for example:
- JDK:
FROM eclipse-temurin:17.0.6_10-jdk-jammy - JRE:
FROM eclipse-temurin:17.0.8_7-jre-jammy
With the JDK, you can confirm tooling is installed by using something like the whereis command or simply typing it into the terminal, assuming it’s on $PATH:
# whereis jcmd
jcmd: /opt/java/openjdk/bin/jcmd
# whereis jstack
jstack: /opt/java/openjdk/bin/jstack
# whereis jmap
jmap: /opt/java/openjdk/bin/jmap
As opposed to using the JRE, you’d see this:
# jcmd
/bin/sh: 1: jcmd: not found
# whereisjcmd
/bin/sh: 2: whereisjcmd: not found
#
If the JDK is not being used and a JRE is:
By going into the console, you can install the relevant matching JDK for your Java major version, for example:
apt-get update -yy
apt-get install openjdk-11-jdk -yy
apt-get update -yy
apt-get install openjdk-17-jdk -yy
After this, typical JDK tooling should now be accessible on $PATH
Outbound connectivity
Installing these tools will require outbound connectivity to the internet for two aspects of this post:
- To install
curl, if it’s not already installed in the container. This is needed to download the actual dotnet tools:- Ubuntu/Debian-based containers can run
apt-get update -yy && apt-get install curl - Alpine-based containers can run
apk add curl
- Ubuntu/Debian-based containers can run
- Using
curlto install and download dotnet tools from over the internet fromhttps://aka.ms
This needs to be taken into account if outbound access is restricted or completely locked down. These requests will potentialy fail.
Determining high CPU or memory
Diagnose and Solve problems
You can use the following detectors in the Diagnose and Solve Problems blade to diagnose these issues:
- Container App Memory Usage
- Container App CPU usage
Metrics blade
You can use the following metric breakdowns in the Metrics blade to diagnose these issues:
- CPU usage
- Memory Working Set Bytes
- Reserved Cores
- Total Reserved Cores
cgroupv2 change
See this GitHub issue - Mitigate Potential Memory Pressure Effects With cgroup v2 - With the change for cgroupv2 from cgroupv1 can introduce unexpected memory management issues for applications. This includes JRE versions 11.0.18 and below in terms of Java.
Review the GitHub issue and the included links for further details. This should only affect memory usage.
Generating dumps or profiling
Best practices
When taking a heap dump, thread dump, or profiling - it is recommended to take a few of these while reproducing the issue for consistent data.
Taking only (1) may show data that is ultimately not relevant - taking multiple of these will show a more consistent theme in terms of what the problem may be - and would be easier to troubleshoot.
There are times when taking multiple dumps/profiles, you may notice one has a variation of data - if this happened to be the one dump/profile you took (if only taking one total), this can cause the investigation to go down the wrong path.
JCMD (Java Flight Recorder)
Java Flight Recorder can be used for high memory, high CPU and slow application scenarios.
- Java Flight Recorder commands through JCMD/JMC reference can be found here.
- Flight Recording options that can be passed to the JVM through JAVA_OPTS can be found here
- Note: The above link is for Java 17, but the API doc can be changed as needed. Commands in the below post will work on Java 8, 11, 17 and likely higher
To start using JFR, go to the Console for the replica you want to run this in.
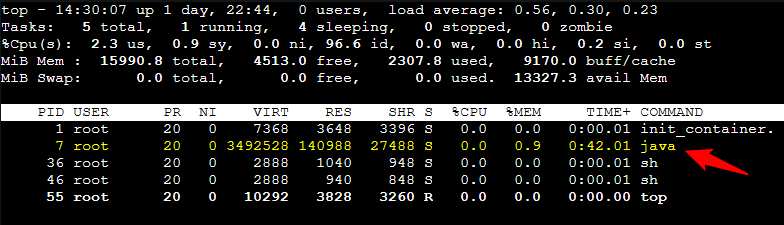
- Get the Java PID by using
toporps- If you’re starting the container through
ENTRYPOINTyou’ll see this being PID 1 along with your Java process - Make sure to get the PID of the actual
javaprocess, not the entrypoint
- If you’re starting the container through
- You can use the below command to start a 30 second profile - to change the profile time just change the
durationflag:jcmd [YOUR_JAVA_PID] JFR.start name=MyRecording settings=profile duration=30s filename="/path/to/volume/jfr_profile.jfr"- Make sure to change
filenameto the volume you previously mounted to save the file for downloading. You can alternatively write this to whatever directory the command is being ran in and thenmvorcpthe file to the volume path.
In conjunction with the image above - and assuming my volume is mounted to
/data/tmp- a real command would look like this:jcmd 7 JFR.start name=MyRecording settings=profile duration=30s filename="/data/tmp/jfr_example2.jfr" - If you wanted to run the command from when the application starts up - you can pass arguments to the JVM through Container App environment variables - the profile will be running until it is stopped. Therefor, these files can get very large:
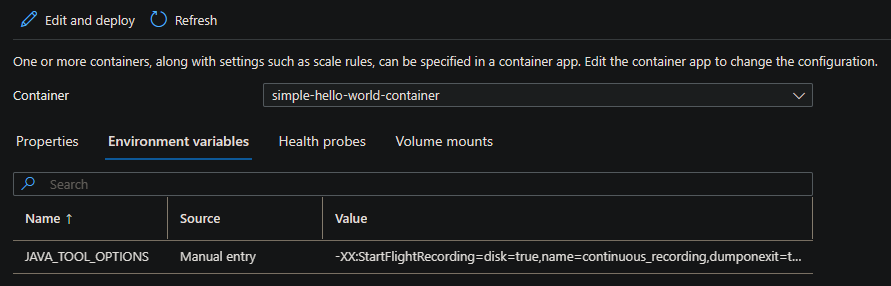
- Go to Containers -> Environment Variables:
- Edit the container you want to add continuous profiling on - the environment variable completely depends on your Java implementation, but for example, you can add
JAVA_TOOL_OPTIONSwith a value of-XX:StartFlightRecording=disk=true,name=continuous_recording,dumponexit=true,maxsize=1024m,maxage=1d
Note: This will create a new revision
-
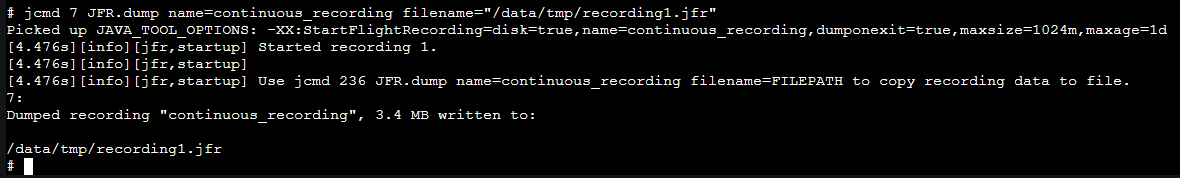
When decided that this has ran long enough, run the following command in Console:
jcmd [JAVA_PID] JFR.dump name=continuous_recording filename="/path/to/volume/jfr_profile.jfr" -
You’ll see the below:
- Download the JFR profiles by going to your Storage Account and File Share mapped to the volume.
Review profiles
You can use Azul Zulu Mission Control to view the results of the JFR files that were created.
jcmd 7 JFR.dump name=continuous_recording filename=”/data/tmp/recording1.jfr”
jStack
jStack is used to take threadumps which are saved as text files. Thread dumps can be useful in high CPU scenarios or application slowness scenarios - thread state can be investigated to see if there are many blocked, locked, or waiting on other threads for completion, amongst other logic.
Information on jstack can be found here - change the documentation to reflect the proper Java SE API as needed.
Thread state information and the states they can be in can be found here - docs.coracle.com - Thread.State
Using the same approve above, with opening a shell through Console to the container and saving this file (or moving it to your volume path to download) run the following commands:
- Get the Java PID through
top - Run:
jstack <pid> > /path/to/volume/threaddump.txt
Since jStack just takes a snapshot of thread state, it is heavily recommended, as mentioned earlier, to take multiple of these while reproducing the issue.
Review thread dumps
You can use a few different thread analyzers to help reviewing thread state:
NOTE: The above are web based tools
jMap
jMap is a utility used to take a snapshot of Java heap space and saves it to a heap dump file.
This is useful for high memory or out of memory scenarios. Since this is also a snapshot, take multiple of these while reproducing the issue.
Information on jmap can be found here - change the documentation to reflect the proper Java SE API as needed.
Following the same approaches explained above:
- Get the Java PID through
top - Run:
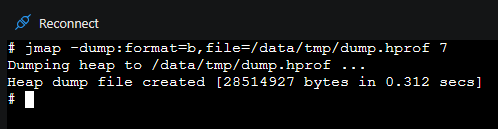
jmap -dump:format=b,file=/path/to/volume/dump.hprof 7
You’ll see output like the below:
Review heap dumps
You can use the Eclipse Memory Analyzer to review Java heap dumps taken with jmap.