Container Apps: How to capture a network trace using TCPDUMP
This post will cover using TCPDUMP to capture a network trace on Container Apps.
Prerequisites
Some important prerequisites are to be able to capture and download the dump file for analysis:
- Ability to download files from the container. This can be done by mounting an Azure File Share with read/write permissions allowed.
- Ability to connect to the container through the Console blade or use the
az containerapp execcommand. See console documentation here
Download files from the container
You’ll need a way to download files from the container. By default, there is no way to get files generated at runtime by a container in Container Apps without some additional configuration.
The most simplistic way is to mount a volume from an Azure File Share with an Azure Storage Account.
For a quickstart on how to add a volume, follow Use storage mounts in Azure Container Apps
Console access
You can use either the Azure CLI or the portal for console access. Below is what portal access would look like:
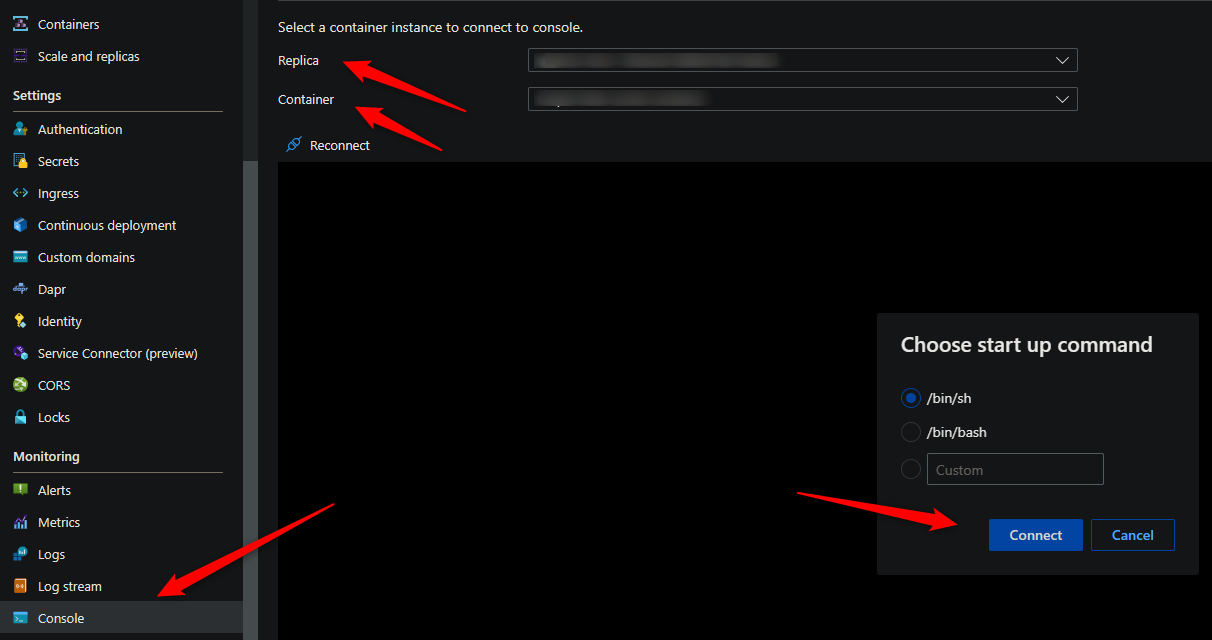
The commands for installing TCPDUMP and capturing a network trace requires access to a terminal - so console access is required.
Installing TCPDUMP
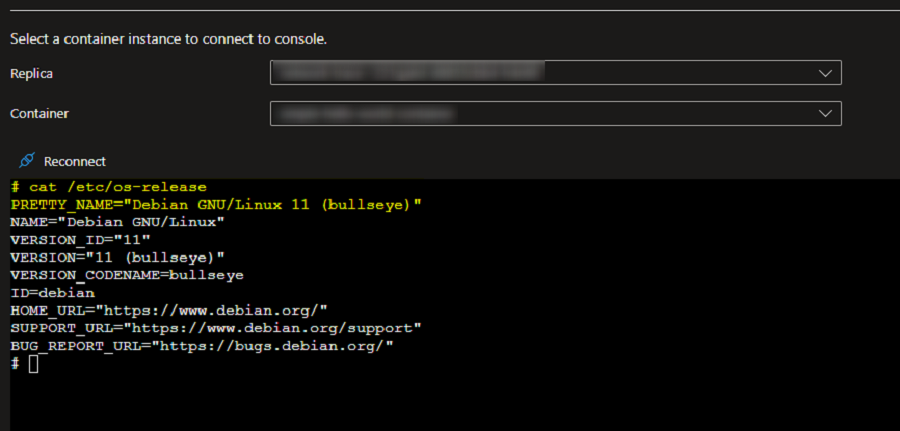
Validate the OS
Run th below command in the console to validate which installation commands to use.
cat /etc/os-release
Install TCPDUMP
For Ubuntu/Jessie/Debian based images, you need to run the below commands:
	apt-get update
	apt install tcpdump
For Alpine based images, you need to run the below commands:
	apk update
	apk add tcpdump
Collect a network trace using TCPDUMP
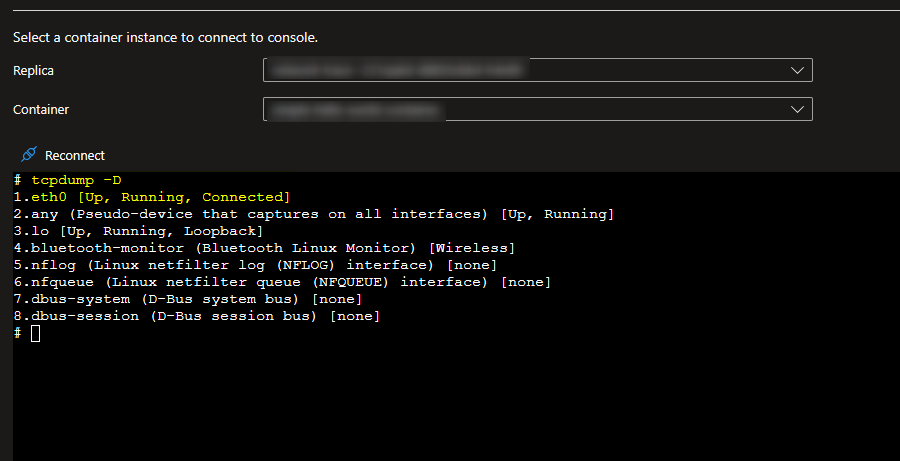
Check which network interface is being used
tcpdump -D
Run TCPDUMP
Once you have identified which network interface you wish to collect the trace on, run the below TCPDUMP command to start collecting the trace for traffic flowing through that particular network interface. The trace will be saved to a file named dump.pcap under your mount path.
tcpdump -i eth0 -s0 -w /MOUNT-PATH/dump.pcap
Reproduce the issue and once complete you can stop the trace in the console with CTRL + C. The dump will then be available to download in your file share.
Explanation of each switch in the above command
-i : is to select which interface the capture is to take place on. If you want to capture traffic on all interfaces use -i any
-s : Snap length, is the size of the packet to capture. -s0 will set the size to unlimited - use this if you want to capture all the traffic.
-w : to write to a capture file.
Analyze the newtork trace
Wireshark can be used to analyze the PCAP file locally.
To analyze the PCAP file in the console, use:
tcpdump -r dump.pcap


