Container Apps: Profiling Dotnet applications for performance issues
This post will cover using Dotnet global troubleshooting tools to help profile performance issues on Container Apps with Dotnet applications.
Overview
Sometimes, applications may encounter issues due to poor performance - either high CPU usage, high memory (or out of memory), generally slow performance due to code execution logic, or others.
In these scenarios, if it’s been determined this is likely an application problem, you can use Dotnet based tooling to profile or take dumps of the application.
Important Prerequisites
Some important prerequisites is to be able to:
- Being able to connect to the container through the Console blade or use the
az containerapp execcommand. See console documentation here - Able to download files from the container
- Be able to install the relevant Dotnet tools if not already installed.
Console access
You can use either the Azure CLI or the portal for console access. Below is what portal access would look like:
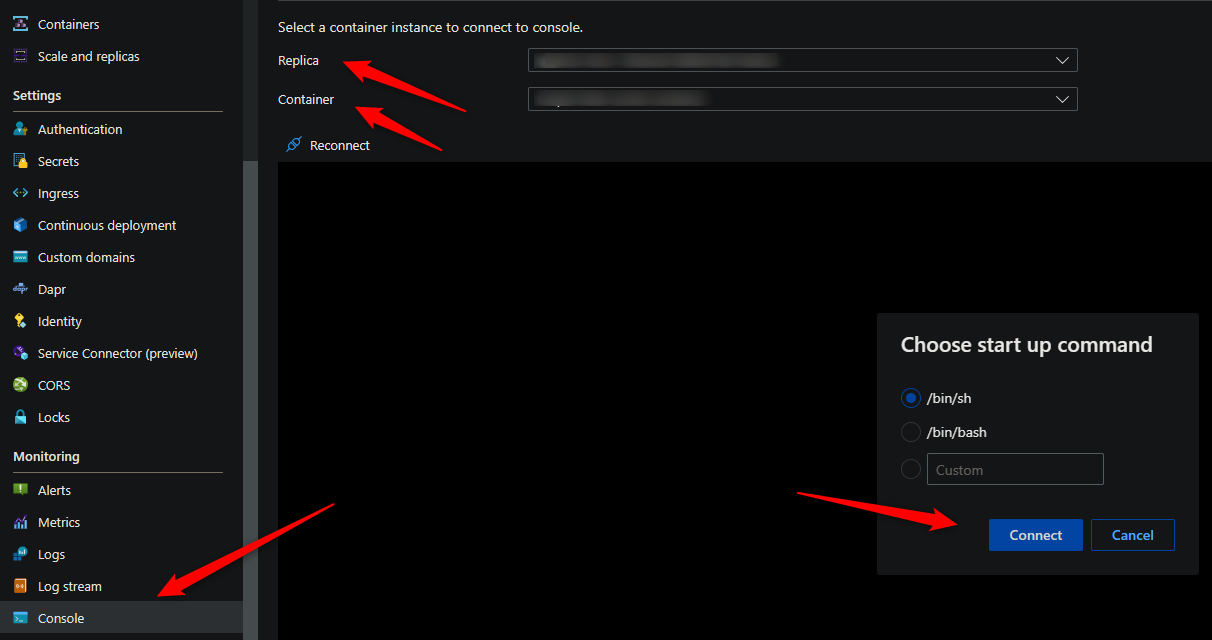
These commands for capturing profiles and dumps require access to a terminal - so console access is required.
Download files from the container
You’ll need a way to download files from the container. By default, there is no way to get files generated at runtime by a container in Container Apps without some additional configuration.
The most simplistic way is to mount a volume from an Azure File Share with an Azure Storage Account.
For a quickstart on how to add a volume, follow Use storage mounts in Azure Container Apps
NOTE: It is advised to add this mount before testing or generating files. If you do this after testing (and in single revision mode, for instance) then a new pod will be created and previous files would be lost.
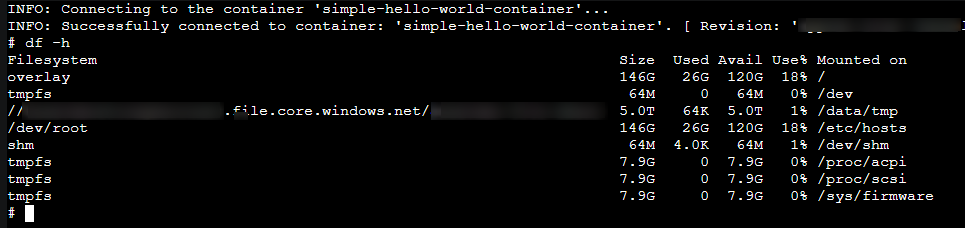
You can validate that the volume is mounted with the df -h command:
Check if the dotnet SDK is present
A common approach is to only use the runtime (ex., dotnet/aspnet:7.0) as the run image instead of the SDK (dotnet/sdk) due to a smaller size and the potential for not needing the extra tooling in an SDK.
- Runtime image example:
FROM mcr.microsoft.com/dotnet/aspnet:7.0 - SDK image example:
FROM mcr.microsoft.com/dotnet/sdk:7.0
If trying to invoke global tools through the CLI, you may see something like the below - assuming it was already or is on $PATH:
dotnet-counters: not found
dotnet-dump: not found
If these tools or not found on the filesystem as an exectuable or not on $PATH - and also confirmed to be using the dotnet runtime image, then these tools are not installed.
Outbound connectivity
Installing these tools will require outbound connectivity to the internet for two aspects of this post:
- To install
curl, if it’s not already installed in the container. This is needed to download the actual dotnet tools:- Ubuntu/Debian-based containers can run
apt-get update -yy && apt-get install curl - Alpine-based containers can run
apk add curl
- Ubuntu/Debian-based containers can run
- Using
curlto install and download dotnet tools from over the internet fromhttps://aka.ms
This needs to be taken into account if outbound access is restricted or completely locked down. These requests will potentialy fail.
Adding commands to path (optional)
If needing to add commands to path for any reason, this can be done by installing the tool below, and running export PATH=/dir/of/thetool/:$PATH. If dotnet tool(s) were installed in home, export PATH=/home:$PATH would need to be ran.
Otherwise, all commands should be ran as ./<dotnettool> (assuming this is being ran relative to the executable).
Determining high CPU or memory
Diagnose and Solve problems
You can use the following detectors in the Diagnose and Solve Problems blade to diagnose these issues:
- Container App Memory Usage
- Container App CPU usage
Metrics blade
You can use the following metric breakdowns in the Metrics blade to diagnose these issues:
- CPU usage
- Memory Working Set Bytes
- Reserved Cores
- Total Reserved Cores
cgroupv2 change
See this GitHub issue - Mitigate Potential Memory Pressure Effects With cgroup v2 - With the change for cgroupv2 from cgroupv1 can introduce unexpected memory management issues for applications. This includes .NET 6 and below in terms of Dotnet.
Generating dumps or profiling
Best practices
When taking a heap dump, thread dump, or profiling - it is recommended to take a few of these while reproducing the issue for consistent data.
Taking only (1) may show data that is ultimately not relevant - taking multiple of these will show a more consistent theme in terms of what the problem may be - and would be easier to troubleshoot.
There are times when taking multiple dumps/profiles, you may notice one has a variation of data - if this happened to be the one dump/profile you took (if only taking one total), this can cause the investigation to go down the wrong path.
dotnet-counters
(Applies for High CPU/Memory): It is a performance monitoring tool for ad-hoc health monitoring and first-level performance investigation. It can observe performance counter values that are published via the EventCounter API. For example, you can quickly monitor things like the CPU usage, or the rate of exceptions being thrown in your .NET Core application to see if there’s anything suspicious before diving into more serious performance investigation using PerfView or dotnet-trace.’’
Follow the steps below to install dotnet-counters:
Installation
- Go to the Console blade for your Container App and select the relevant revision and container to connect to
- Run
curl -L https://aka.ms/dotnet-counters/linux-x64 -o dotnet-countersfollowed bychmod +x dotnet-counters. - This will make
dotnet-countersexecutable. The curl command will install and create this binary in the current working directory.
# dotnet-counters collect -p 1
--counters is unspecified. Monitoring System.Runtime counters by default.
Starting a counter session. Press Q to quit.
File saved to counter.csv
NOTE The above command assumes the command was put onto
PATH
- To save this to a specific directory other than the current directory, such as the volume mounted for persistent storage, use the
-oflag - example:dotnet-counters collect -p 1 -o /path/to/volume/dotnet-counters-1.csv
Files are saved as .csv by default but can be changed to .json as well. Optionally, the monitor flag can be used to display output within the terminal. Below is an example using ./dotnet-counters monitor -p <PID>:
Press p to pause, r to resume, q to quit.
    Status: Running

[System.Runtime]
    % Time in GC since last GC (%)                                         0
    Allocation Rate (B / 1 sec)                                        8,168
    CPU Usage (%)                                                          0.12
    Exception Count (Count / 1 sec)                                        0
    GC Committed Bytes (MB)                                                0
    GC Fragmentation (%)                                                   0
    GC Heap Size (MB)                                                      5.902
Review the official documentation for more passable flags.
dotnet-trace
(Applies for High CPU and Slow Apps): .NET Core includes what is called the EventPipe through which diagnostics data is exposed. The dotnet-trace tool allows you to consume profiling data from your app that can help in scenarios where you need to root cause apps running slow.
Installation
- Go to the Console blade for your Container App and select the relevant revision and container to connect to
- Run
curl -L https://aka.ms/dotnet-trace/linux-x64 -o dotnet-tracefollowed bychmod +x dotnet-trace. This will makedotnet-traceexecutable. Thecurlcommand will install and create this binary in the current working directory.
Running the command
- Run
./dotnet-trace psto get the current Dotnet PID, followed by./dotnet-trace collect -p <PID>. UseENTERorCTRL+Cto terminate. The below should be seen:
# dotnet-trace collect -p 1
No profile or providers specified, defaulting to trace profile 'cpu-sampling'

Provider Name                           Keywords            Level               Enabled By
Microsoft-DotNETCore-SampleProfiler     0x0000F00000000000  Informational(4)    --profile
Microsoft-Windows-DotNETRuntime         0x00000014C14FCCBD  Informational(4)    --profile

Process        : /usr/share/dotnet/dotnet
Output File    : /app/dotnet_20230912_144236.nettrace

[00:00:00:22]   Recording trace 3.0179   (MB)
NOTE The above command assumes the command was put onto
PATH
- To save this to a specific directory other than the current directory, such as the volume mounted for persistent storage, use the
-oflag - example:dotnet-trace collect -p 1 -o /path/to/volume/dotnet_20230912_trace.nettrace
Review the official documentation for more passable flags.
dotnet-dump
(Applies for High CPU/Memory/Slow Apps/DeadLocks, etc): It is a way to collect and analyze Windows and Linux core dumps without a native debugger.
Installation
- Go to the Console blade for your Container App and select the relevant revision and container to connect to
- Run
curl -L https://aka.ms/dotnet-dump/linux-x64 -o dotnet-dumpfollowed bychmod +x dotnet-dump. This will make dotnet-dump executable. Thecurlcommand will install and create this binary in the current working directory.
Running the command
- Run
./dotnet-dump psto get the current Dotnet PID, followed by./dotnet-dump collect -p <PID>. The below should be seen:
# dotnet-dump collect -p 1

Writing full to /app/core_20230912_145802
Complete
- To save this to a specific directory other than the current directory, such as the volume mounted for persistent storage, use the
-oflag - example:dotnet-dump collect -p 1 -o /path/to/volume/dotnet_20230912_trace.nettrace
Review the official documentation for more passable flags.
dotnet-gcdump
(Applies for High Memory): It collects GC (Garbage Collector) dumps of live .NET processes using EventPipe. GC dumps are created by triggering a GC in the target process, turning on special events, and regenerating the graph of object roots from the event stream. These dumps are useful for several scenarios.
Installation
- Go to the Console blade for your Container App and select the relevant revision and container to connect to
- Run
curl -L https://aka.ms/dotnet-gcdump/linux-x64 -o dotnet-dumpfollowed bychmod +x dotnet-gcdump. This will make dotnet-dump executable. Thecurlcommand will install and create this binary in the current working directory.
Running the command
- Run
./dotnet-gcdump psto get the current Dotnet PID, followed by./dotnet-gcdump collect -p <PID>. The below should be seen:
# dotnet-gcdump collect -p 1
Writing gcdump to '/app/20230912_150741_1.gcdump'...
        Finished writing 612591 bytes.
-
To save this to a specific directory other than the current directory, such as the volume mounted for persistent storage, use the
-oflag - example:dotnet-gcdump collect -p 1 -o /path/to/volume/20230912_150741_1.gcdump -
Next, run
./dotnet-gcdump report 00000000_000000_00.gcdump. This will output the report to stdout. Note this may be a large amount of output, so it may be more advisable to download this file and open this with Perfview or Visual Studio.
NOTE: To walk the GC heap, this command triggers a generation 2 (full) garbage collection, which can suspend the runtime for a long time, especially when the GC heap is large. Don’t use this command in performance-sensitive environments when the GC heap is large.
Review the official documentation for more passable flags.
Tool troubleshooting
Permission Denied
For any tools that are downloaded via curl, you may see /bin/sh: 40: dotnet-gcdump: Permission denied - for example.
This can happen if chmod +x [toolname] is not ran. Rerun this to ensure the tool is executable.
Syntax error: redirection unexpected
You may see this error on any of the tools installed, below is an example:
app/dotnet-gcdump: 1: Syntax error: redirection unexpected
This can happen if you mistype the domain to download the tool, eg:
- Proper: https://aka.ms/dotnet-gcdump/linux-x64
- Inproper: https://aka.ms/dotnet-gcdump/linux-64
Correct the download URI and redownload the binary.


