Container Apps: Profiling Go applications for performance issues
This post will cover using Go troubleshooting tools to help profile performance issues on Container Apps with Go applications.
Overview
Sometimes, applications may encounter issues due to poor performance - either high CPU usage, high memory (or out of memory), generally slow performance due to code execution logic, or others.
In these scenarios, if it’s been determined this is likely an application problem, you can use Go based tooling to profile or take dumps of the application.
Important Prerequisites
Some important prerequisites is to be able to:
- Being able to connect to the container through the Console blade or use the
az containerapp execcommand. See console documentation here - Able to download files from the container
There is no out-of-the-box method to profile/generate a dump for an application container on Container Apps. To understand if there is application slowness, either due to high CPU, high memory, dependency problems, or other reasons - a profiler typically specific to the language/runtime you’re using should be used.
In the case of Go - profilers in this article are installed as packages and used through code or configuration. This should be validated and tested locally to ensure this works before testing on Container Apps.
Console access
You can use either the Azure CLI or the portal for console access. Below is what portal access would look like:
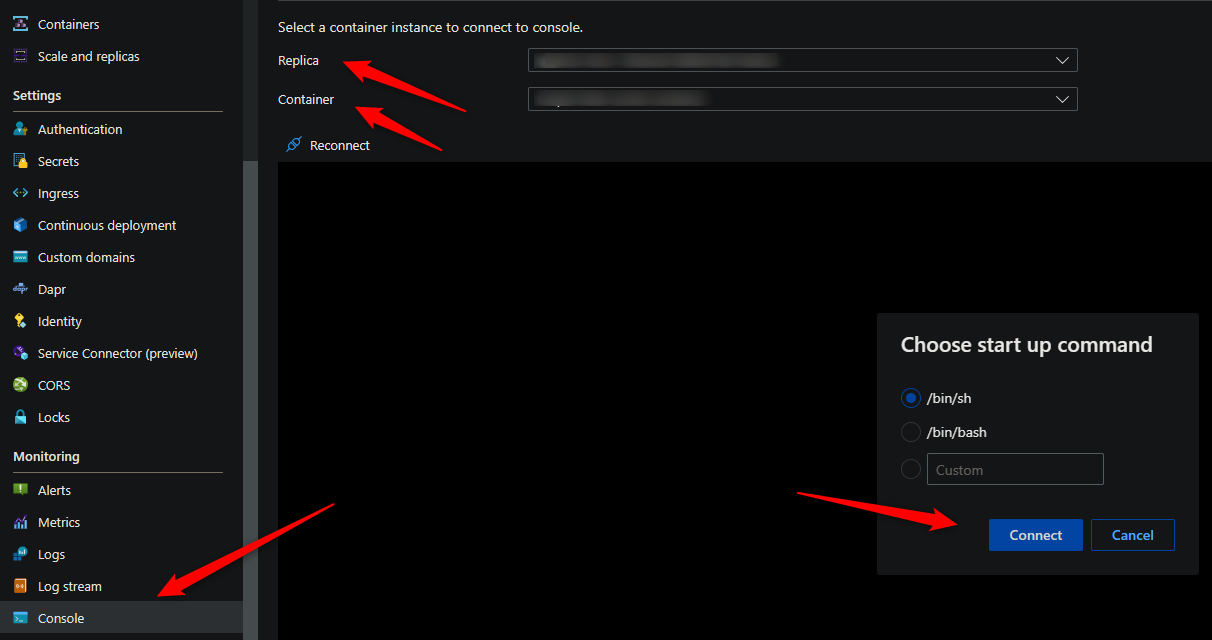
These commands for capturing profiles and dumps require access to a terminal - so console access is required.
Download files from the container
You’ll need a way to download files from the container. By default, there is no way to get files generated at runtime by a container in Container Apps without some additional configuration.
The most simplistic way is to mount a volume from an Azure File Share with an Azure Storage Account.
For a quickstart on how to add a volume, follow Use storage mounts in Azure Container Apps
NOTE: It is advised to add this mount before testing or generating files. If you do this after testing (and in single revision mode, for instance) then a new pod will be created and previous files would be lost.
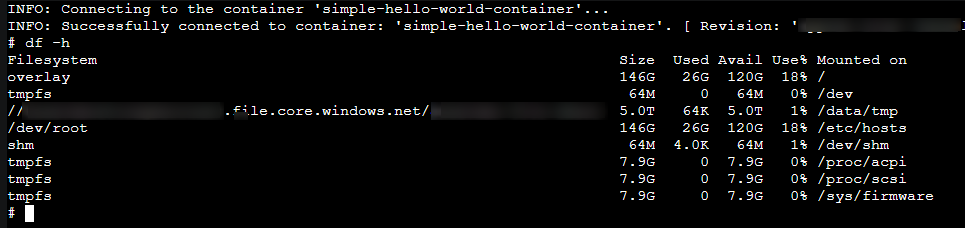
You can validate that the volume is mounted with the df -h command:
Determining high CPU or memory
Diagnose and Solve problems
You can use the following detectors in the Diagnose and Solve Problems blade to diagnose these issues:
- Container App Memory Usage
- Container App CPU usage
Metrics blade
You can use the following metric breakdowns in the Metrics blade to diagnose these issues:
- CPU usage
- Memory Working Set Bytes
- Reserved Cores
- Total Reserved Cores
cgroupv2 change
See this GitHub issue - Mitigate Potential Memory Pressure Effects With cgroup v2.
Compared to other languages or runtimes - there does not seem to be known issues between the cgroupv1 to cgroupv2 changeover for Go.
Generating dumps or profiling
Best practices
When taking a heap dump, thread dump, or profiling - it is recommended to take a few of these while reproducing the issue for consistent data.
Taking only (1) may show data that is ultimately not relevant - taking multiple of these will show a more consistent theme in terms of what the problem may be - and would be easier to troubleshoot.
There are times when taking multiple dumps/profiles, you may notice one has a variation of data - if this happened to be the one dump/profile you took (if only taking one total), this can cause the investigation to go down the wrong path.
CPU profiling
net/http/pprof
Go provides a built-in package for standalone applications to generate profile and heap data. This relies on the net/http/pprof package which will register pprof endpoints to initiate CPU or heap dump collection.
This is assuming that nil is passed to ListenAndServe method, which will use the DefaultServeMux and automatically register the pprof route handlers. If a custom Mux is used, like
r := http.NewServeMux()
..
err := http.ListenAndServe(":8080", r)
Then it is required to manually add these routes pprof normally would add to your router.
Other frameworks may offer an implementation of pprof - such as Fiber’s pprof middleware usage
In either case, you can access the following route to start CPU profiling:
/debug/pprof/profile?seconds=30- Takes a CPU profile for n number of seconds
Wherever their HTTP service is being initiated, which is likely in their main function. They can easily swap out their existing /net/http package with the below. Both are apart of the built-in Go standard library.
For instance, before:
import (
	"log"
	"net/http"

	"github.com/azureossd/go-deployment-samples/cars"
	"github.com/azureossd/go-deployment-samples/fibonacci"
)
After:
import (
	"log"
        "net/http"
	_ "net/http/pprof"

	"github.com/azureossd/go-deployment-samples/cars"
	"github.com/azureossd/go-deployment-samples/fibonacci"
)
- This will automatically add route handlers under the
/debug/*endpoint for the application as what’s referenced here. Note, that these will not exist in actual code for the application (if usingDefaultServeMux) - these are exclusively offered from the implementation of thenet/http/pprofpackage. - You can initiate a CPU profile by calling the
/debug/pprof/profile?seconds=30route on the application that’s deployed with thenet/http/pprofpackage. For example, https://somefakesite.funnyname-1234ab45.someregion.azurecontainerapps.io/debug/pprof/profile?seconds=30. - This will then download a file named
profileto your local computer. This can now be read and analyzed with other performance tools.
pkg/profile
Profiling can also be done with the profile package. The GitHub package for this can be found here. This is intended to be done as profiling through code. This can be implemented as easily as:
import (
	...other imports
	"github.com/pkg/profile"
)

func main() {
  defer profile.Start().Stop()
  .. other code
}
By default, this package will take CPU profiles if no other arguments are provided for profile or heap type.
Important: Using this package comes with a few caveats.
- This package only writes to one file named
cpu.pprof. The profiling session is only flushed after aSIGINTis sent - This means after a container is killed/restarted, it will not cleanly flush out the buffer to this file. Therefor, the file will be empty.
- Furthermore, in a typical use case, you may not know exactly where the problem code is. So it makes sense to place the profiler in the
mainfunction when the server starts. Because of this, there is a handle open on this file - so may not be able to delete it while profiling is being ran.
To work around this, we can do the following:
- Create a unique ID which we can pass to
profile.ProfilePath, which lets us change the directory where the file is created it. This creates a unique directory each time, to avoid consistently locking the samecpu.pproffile.
A full code example looks like this:
package main

import (
	"log"
	"net/http"
	"os"
	"path/filepath"

	"github.com/azureossd/go-performance-examples/profile/fibonacci"
	"github.com/azureossd/go-performance-examples/profile/index"
	"github.com/google/uuid"
	"github.com/pkg/profile"
)

func main() {
	id := uuid.New().String()
	path := filepath.Join("/app/mnt", id)
	// This creates a file named cpu.pprof in a directory named /app/mnt
	defer profile.Start(profile.ProfilePath(path)).Stop()
	http.HandleFunc("/", index.Index)
	http.HandleFunc("/api/fib", fibonacci.Fibonacci)

	log.Println("Server listening on port 8080.")
	err := http.ListenAndServe(":8080", nil)

	if err != nil {
		log.Fatal(err)
	}
}
How to write out and download the profile:
- When profiling is done, the easiest way to flush out the data from the buffer to the file is to send a
SIGINTsignal from a Console session in the application. - In an SSH session, run
topto get the current PID - Run
kill -SIGINT [pid]- where PID is the PID of the Go Process. - This will kill the container - and create a new pod/replica
- To ensure this persists, make sure a volume was mounted and the file was written to the mount location - otherwise, when the container is killed the file will be deleted.
Memory and heapdumps
net/http/pprof
Following the same steps for enablement in the CPU profiling - net/http/pprof section above, you can use net/http/pprof to take heap dumps for memory as well.
You can access the following route to generate a heap snapshot:
/debug/pprof/heap- Takes a heap dump snapshot at that given time
Additional usage examples of the net/http/pprof package can be found here.
pkg/profile
Following the same steps for enablement in the CPU profiling - pkg/profile section above, you can use profile to take heap dumps for memory as well.
The Go package for this can be found here. This is intended to be done as heap dump collection through code. This can be implemented as easily as:
import (
	...other imports
	"github.com/pkg/profile"
)

func main() {
  defer profile.Start(profile.MemProfile).Stop()
  .. other code
}
By default, this package will take CPU profiles if no other arguments are provided for profile or heap type.
NOTE: The same caveats about file locking and the need for SIGINT applies to heapdumps as using this package.
Reading profiles and dumps
Heap dumps
go tool pprof
Command Line/Text based
You can use the Go cli with the go tool command to read heap dumps. This uses pprof to help read or visualize heap dumps.
To do this, open the downloaded heap file to your local machine. This should be placed in the root directory of the application on the local machine.
Relative to the heap file, run the following command:
go tool pprof heap
This will start an interactive session with pprof. You can experiment with some commands to read through the heap dump.
-
top10- this command will show top 10 functions ran during the specific heap generation period.- Other input options to
pprofin a text based terminal can be found here.
- Other input options to
NOTE: The above example is just for top10 - the command itself is
topn, wherenis the topnamount of function calls to look at. You can input something liketop15ortop20.
  (pprof) top10
Showing top 10 nodes out of 18
      flat  flat%   sum%        cum   cum%
 2017.19kB 69.97% 69.97%  2882.88kB   100%  github.com/azureossd/go-performance-examples/memory/profile/cityarray.CityArray
  789.54kB 27.39% 97.36%   789.54kB 27.39%  unicode/utf16.Encode
   76.15kB  2.64%   100%    76.15kB  2.64%  reflect.packEface
         0     0%   100%    76.15kB  2.64%  fmt.(*pp).doPrintln
         0     0%   100%    76.15kB  2.64%  fmt.(*pp).printArg
         0     0%   100%    76.15kB  2.64%  fmt.(*pp).printValue
         0     0%   100%   865.69kB 30.03%  fmt.Fprintln
         0     0%   100%   865.69kB 30.03%  fmt.Println (inline)
         0     0%   100%   789.54kB 27.39%  internal/poll.(*FD).Write
         0     0%   100%   789.54kB 27.39%  internal/poll.(*FD).writeConsole
You can filter by column name with top10 -[columnname]
Important interests:
- File: This shows the binary name it was ran against. This one was ran against a deployed application on Azure where the binary is always renamed to oryxBuildBinary when built by Oryx
- Time: The time the profile was ran
- Duration: The specified duration of the profile and local time.
- flat: This is the time spent within a function doing direct operations. This is not accounting for the fact that a function (ex. foo) invokes a function named bar.
- cum: This is the time spent on said function that includes both direct operations and indirect operations and invocations (eg., execution of loops in the function, then function calls for outside functions)
- sum: Sum is the added percent of time between in previous lines. This is equated by adding the flat column up for the previous lines which equals the sum of all those lines.
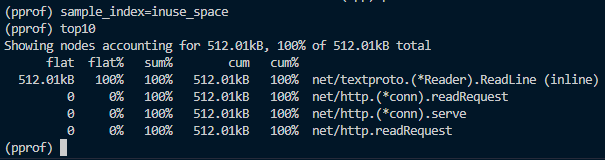
The default type of sampling is inuse_space. This is for live objects and does not show past allocations of memory.
Other types of memory sampling are as followed - this can be beneficial to check for past memory allocation, especially if there is a leak of a certain object.
- alloc_space - Memory space that is allocated now plus memory that has been previously deallocated
- inuse_objects - This will display the current number of in-use objects that are allocated. This does not account for freed objects
- alloc_objects - This counts objects that are current allocated plus all freed objects.
You can switch between sampling indexes in the current pprof session. For instance in the below image. You’ll need to set the sample_index and then rerun a topn command to see the difference:
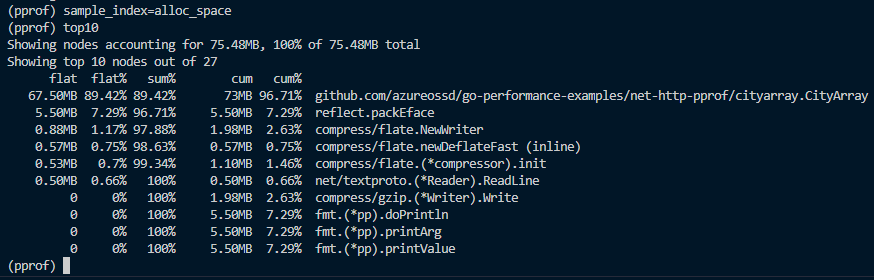
In the above example, when changing the sample_index type to alloc_space, we can see a pretty noticeable difference with what functions were invoked, with application code being at the top. In the default inuse_space, we can see this is significantly different, at this time, due to those objects not being in use and were freed up, thus now being labelled as a past allocation. At the time of this heap dump, those previous objects (city.CityArray) were not in-use.
Visualize heap dump outputs
Prerequisites:
- GraphViz needs to be installed. The simplest way is to use Chocolately to install this. GraphViz downloads can be viewed here.
- To invalid via Choclately - run
choco install graphvizfrom an elevated terminal.
- To invalid via Choclately - run
- There is the option to manually extract the Zip and place this on
PATH, however, this may still not be picked up bypprof.
If GraphViz is not installed, incorrectly installed or not able to be found on PATH you will see this message when trying to invoke the below web option for visualization:
failed to execute dot. Is Graphviz installed? Error: exec: "dot": executable file not found in %PATH%
You can visualize heap dump outputs with go tool pprof by using the web option. This will output this into a callgraph which is rendered by GraphViz.
-
Run
go tool pprof heapi. For example,
go tool pprof [name_of_heap_file] -
In the interactive terminal, enter
web. Eg., -
This will now visualize the output into a rendered
.svgimage - this will open in a new tab.
CPU profiles
You can use the Go cli with the go tool command to read CPU profiles. This uses pprof to help read or visualize profiles.
To do this, open the downloaded profile file to your local machine. This should be placed in the root directory of the application on the local machine.
You can run the below command against either a built Go binary or directly against your entrypoint .go file. In the root of your local application, run the following command:
go tool pprof someBinary profile
Or
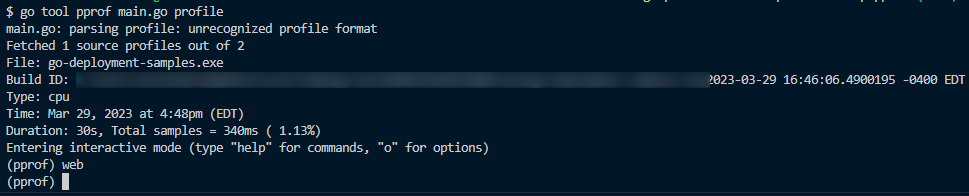
go tool pprof main.go profile
This will start an interactive session with pprof. You can experiment with some commands to read through the profile.
-
top10- this command will show top 10 functions ran during the specific profiling/sampling period. ThetopNcommand is sorted by the second column by default, which is the column that shows how many times said function ran during the sampling/profiling period.- Other input options to
pprofin a text based terminal can be found here.
- Other input options to
NOTE: The above example is just for top10 - the command itself is
topn, wherenis the topnamount of function calls to look at. You can input something liketop15ortop20.
  File: oryxBuildBinary
  Type: cpu
  Time: Mar 29, 2023 at 7:07pm (EDT)
  Duration: 30s, Total samples = 560ms ( 1.87%)
  Entering interactive mode (type "help" for commands, "o" for options)
  (pprof) top10
  Showing nodes accounting for 560ms, 100% of 560ms total
      flat  flat%   sum%        cum   cum%
     400ms 71.43% 71.43%      560ms   100%  github.com/azureossd/go-deployment-samples/fibonacci.Fib
     160ms 28.57%   100%      160ms 28.57%  runtime.asyncPreempt
         0     0%   100%      560ms   100%  github.com/azureossd/go-deployment-samples/fibonacci.Fibonacci
         0     0%   100%      560ms   100%  net/http.(*ServeMux).ServeHTTP
         0     0%   100%      560ms   100%  net/http.(*conn).serve
         0     0%   100%      560ms   100%  net/http.HandlerFunc.ServeHTTP
         0     0%   100%      560ms   100%  net/http.serverHandler.ServeHTTP
You can filter by column name with top10 -[columnname]
Important interests:
- File: This shows the binary name it was ran against.
- Time: The time the profile was ran
- Duration: The specified duration of the profile and local time.
- flat: This is the time spent within a function doing direct operations. This is not accounting for the fact that a function (ex.
foo) invokes a function namedbar. - cum: This is the time spent on said function that includes both direct operations and indirect operations and invocations (eg., execution of loops in the function, then function calls for outside functions)
- sum: Sum is the added percent of time between in previous lines. This is equated by adding the
flatcolumn up for the previous lines which equals the sum of all those lines.
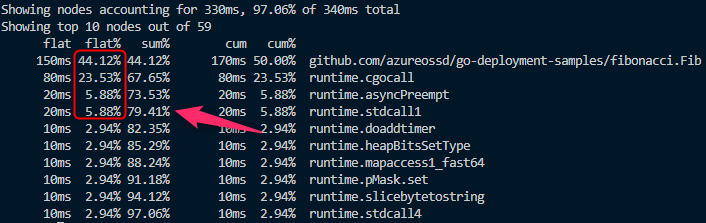
Addition is started from the first line and working downward. If we add the 4 flat lines above (41.12, 23.53, 5.88, 5.88) that will equate to a sum of 79.41% on the fourth line. Since this was a CPU profile, this shows that the first four functions consumed 79.41% CPU time alone.
We can see in this example that fibonacci.Fib took up most time of the CPU during profiling. In this case, fibonacci refers to the package name and Fib is the function being invoked.
  func Fib(n int) uint64 {
	if n == 0 {
		return 0
	} else if n == 1 {
		return 1
	} else {
		return Fib(n - 1) + Fib(n - 2)
	}
  }
Visualize profile outputs
Prerequisites:
Follow the prerequisites portion under the Visualize profile outputs in the heap dump section above.
You can visualize profile outputs with go tool pprof by using the web option. This will output this into a callgraph which is rendered by GraphViz.
-
Run
go tool pprof [entrypoint .go file or built binary] [name of CPU profile]i. For example,
go tool pprof main.go profile -
In the interactive terminal, enter
web. Eg.,
- This will now visualize the output into a rendered
.svgimage - this will open in a new tab.
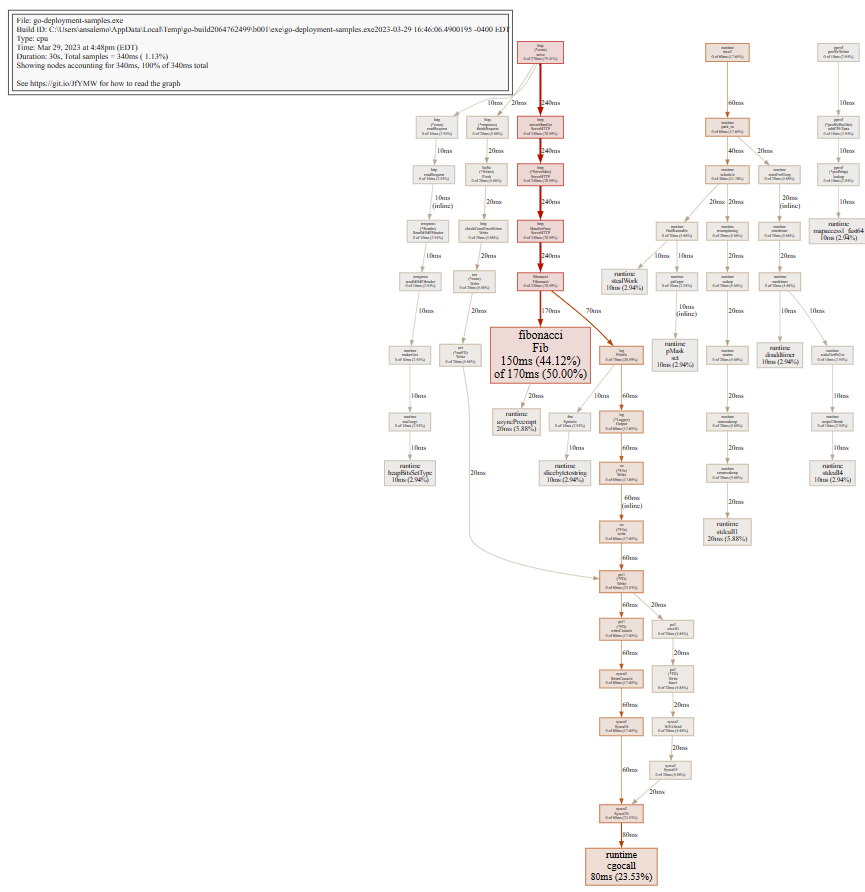
- This includes the same information regarding
flat,sumandcumvalues. You can read how to intepret this graph here


