Container Apps: Profiling Python applications for performance issues
This post will cover using troubleshooting tools to help profile performance issues on Container Apps with Python applications.
Overview
Sometimes, applications may encounter issues due to poor performance - either high CPU usage, high memory (or out of memory), generally slow performance due to code execution logic, or others.
In these scenarios, if it’s been determined this is likely an application problem, you can use troubleshooting tooling to profile or take dumps of the application.
This post will explain how to view or download profile/dump files - and show a few libraries that can be used to help with CPU and/or memory profiling/dumps.
Note, that this post does not cover any specific web framework or web library in terms of Python Web-based applications. The packages discussed in this post are in terms of generalized usage.
Important Prerequisites
Some important prerequisites is to be able to:
- Being able to connect to the container through the Console blade or use the
az containerapp execcommand. See console documentation here - Able to download files from the container
There is no out-of-the-box method to profile/generate a dump for an application container on Container Apps. To understand if there is application slowness, either due to high CPU, high memory, dependency problems, or other reasons - a profiler typically specific to the language/runtime you’re using should be used.
In the case of Python - most profilers are installed as packages and used through code. This should be validated and tested locally to ensure this works before testing on Container Apps.
Console access
You can use either the Azure CLI or the portal for console access. Below is what portal access would look like:
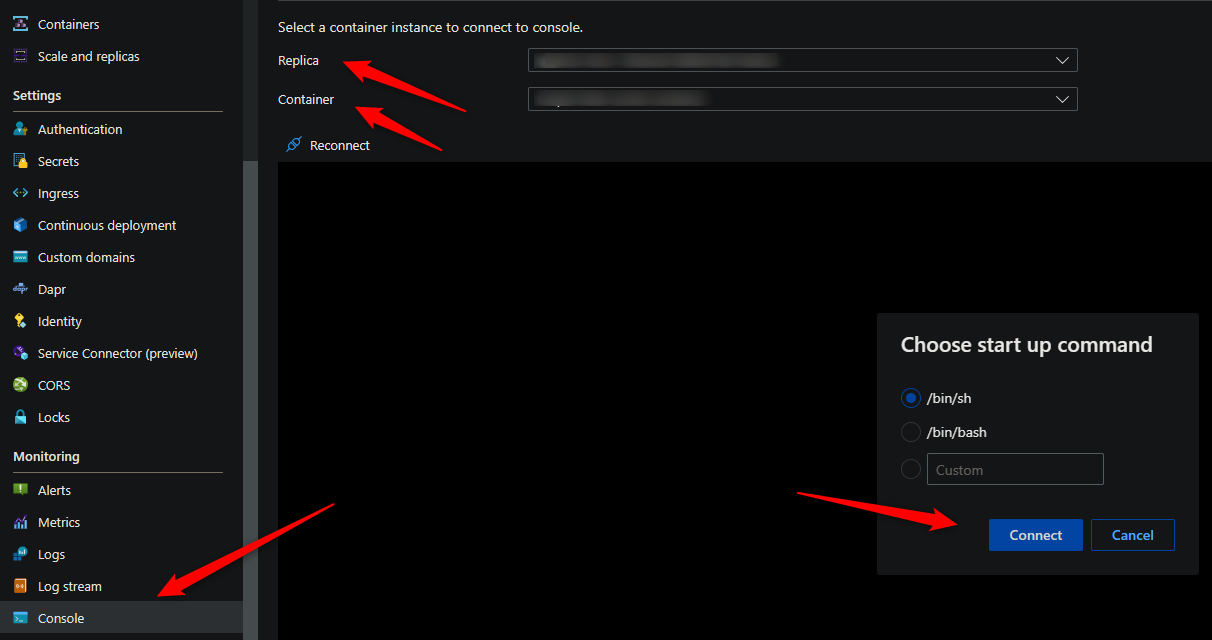
These commands for capturing profiles and dumps require access to a terminal - so console access is required.
Download files from the container
You’ll need a way to download files from the container. By default, there is no way to get files generated at runtime by a container in Container Apps without some additional configuration.
The most simplistic way is to mount a volume from an Azure File Share with an Azure Storage Account.
For a quickstart on how to add a volume, follow Use storage mounts in Azure Container Apps
NOTE: It is advised to add this mount before testing or generating files. If you do this after testing (and in single revision mode, for instance) then a new pod will be created and previous files would be lost.
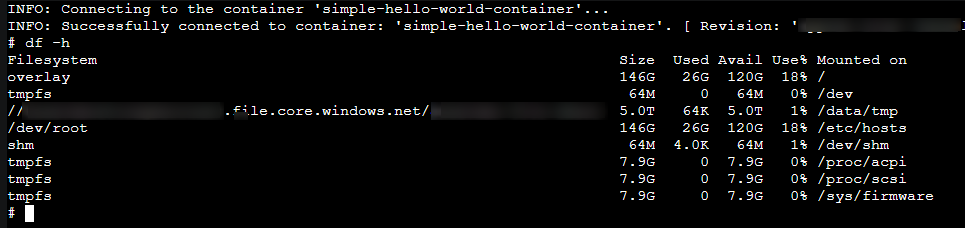
You can validate that the volume is mounted with the df -h command:
Determining high CPU or memory
Diagnose and Solve problems
You can use the following detectors in the Diagnose and Solve Problems blade to diagnose these issues:
- Container App Memory Usage
- Container App CPU usage
Metrics blade
You can use the following metric breakdowns in the Metrics blade to diagnose these issues:
- CPU usage
- Memory Working Set Bytes
- Reserved Cores
- Total Reserved Cores
cgroupv2 change
See this GitHub issue - Mitigate Potential Memory Pressure Effects With cgroup v2 - With the change for cgroupv2 from cgroupv1 can introduce unexpected memory management issues for applications.
Generating dumps or profiling
Best practices
When taking a heap dump, thread dump, or profiling - it is recommended to take a few of these while reproducing the issue for consistent data.
Taking only (1) may show data that is ultimately not relevant - taking multiple of these will show a more consistent theme in terms of what the problem may be - and would be easier to troubleshoot.
There are times when taking multiple dumps/profiles, you may notice one has a variation of data - if this happened to be the one dump/profile you took (if only taking one total), this can cause the investigation to go down the wrong path.
NOTE: When profiling an application, there is the chance this creates further negative performance impact (while profiling is occurring). This should be noted, especially for production environments.
High CPU
py-spy (recommended)
py-spy is an out-of-process profiler that can be invoked through the terminal via Connect to a container console in Azure Container Apps or certain startup scripts/logic in the image/container.
This can be very beneficial in the sense that code changes do not need to happen to implement profilers. Sometimes, this can introduce side-effects, like performance issues since most profilers run in the same Python process - and could affect production traffic. In other cases, you’d need to figure out which peice of code to wrap profiler function calls around to properly profile (and assuming it doesn’t break the application)
py-spy’s implementation negates the above and makes it safe to use.
The only that is required is to install py-spy into the current activated virtual environment. You can either:
- Explicitly add
py-spyinto yourrequirements.txt. You can invoke this programmatically. Although if you’re expecting to invoke this through Console, a virtually, then either a virtual environment should be activated, or available globally. In that case, it may be better to go with the below approach - Or, go into Console and run
pip install py-spy(assumingpipis installed and available from your image/container)
NOTE: If outbound internet connectivity is blocked, package installation will fail. This also may fail if your container user is not
root(or a user without relevant permissions)
Usage
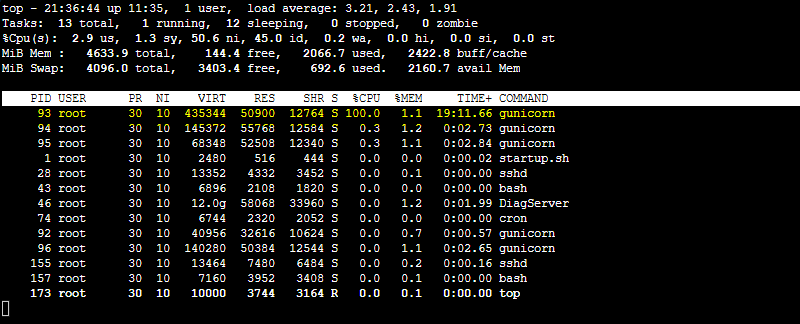
pyspy-top (“top” like output)
Go into Console, and run top or ps to get the PID of the Python process consuming the most CPU. Using Gunicorn again, we can see it’s consuming 100% CPU. The pid here is 93
You can use the py-spy top --pid [appprocesspid] which essentially displays a top-like output through py-spy. In this case, we’d run py-spy top --pid 93. The output looks like this:
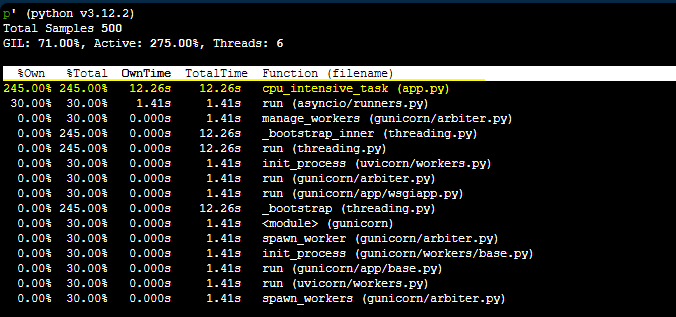
Using py-spy top, we can see in this case the function cpu_intensive_task being called in app.py is consuming the most time.
Continuous recording
This method lets you continuously record a sample profiler of the application.
If you want to output this to a file, you can use a flamegraph. The command py-spy record will run a sample with a default of 100 times a second - this will write out to the file when cancelled with CTRL + C. Write the file to a persistent storage mount with Azure Files so these can be downloaded from the file share.
The command to use is py-spy record -o /path/to/storage/profile.svg --pid [appprocesspid]. In this case, py-spy record -o /path/to/storage/profile.svg --pid 93. Output of running the command is below:

Download the generate file, in this case, profile.svg, and then open it locally in your browser:
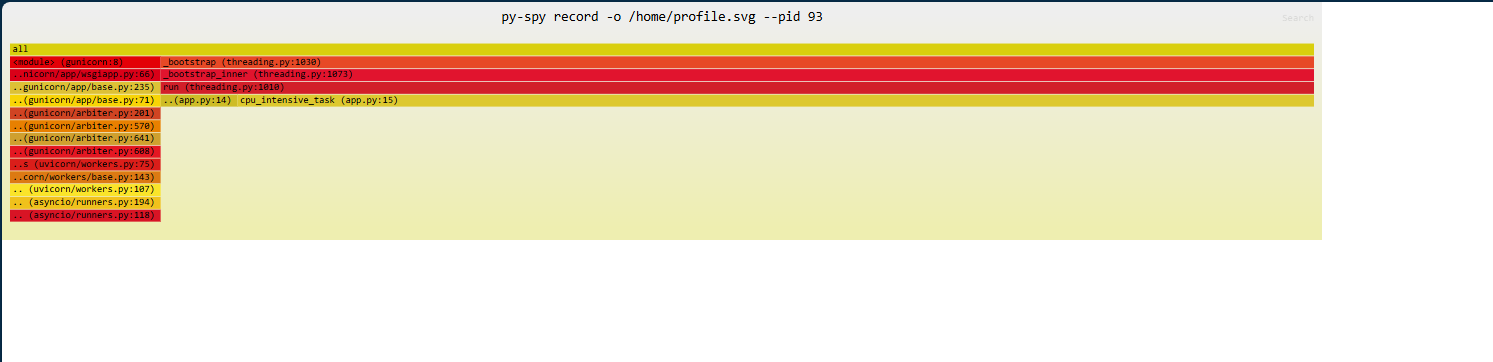
Each call can be clicked on and drilled into.
Thread dump
You can use py-spy dump --pid [appprocesspid] to do a thread dump of the process in question. This will write to stdout in the terminal by default.
The below example runs ``py-spy dump –pid 94`
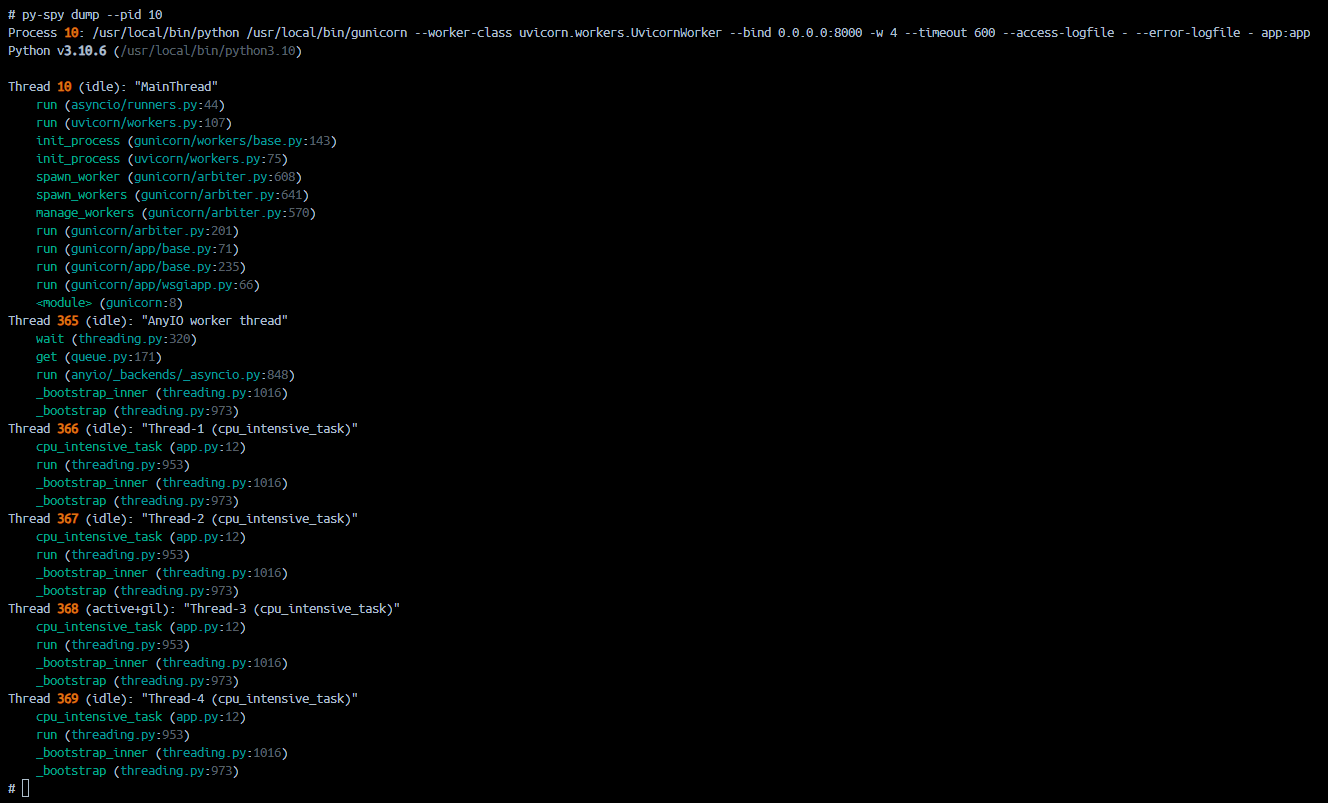
This gives more insight into what code is executed, per thread - and can be helpful in multipthreading Python applications (and others). This can also be useful in generally “slow” applications where high CPU is not present, but persistent slowness is.
cProfile
cProfile is a C-based profiler a part of the Python standard library. No external packages are needed.
If you have identified some specific functions, chunk of code or routes where the problem can be, you can run the profiler to those targeted functions instead of run the profiler in the whole script.
NOTE: If you don’t have an idea as to what may be causing slowness/high CPU usage, then this may not be an entirely good option.
To use this package, do the following:
- Import the libraries:
import cProfile, pstats, io
from pstats import SortKey
- Select the function/method or route that you think it is taking more CPU time. To enable/disable the profile you will need the following code:
pr = cProfile.Profile()
pr.enable()
# ... do something in your code ...
result = firstMethod()

pr.disable()

s = io.StringIO()
sortby = SortKey.CUMULATIVE
ps = pstats.Stats(pr, stream=s).sort_stats(sortby)
ps.dump_stats("/path/to/volume/profiles/profile.txt")
- Use the
ps.dump_stats()function to point this to where your mounted volume path is to save and persist your profiling data. You can later download this from the Azure File Share to review.
An example of the output from this profiler is the below:
Thu Sep 28 15:04:27 2023    profile.txt

         13530 function calls (2 primitive calls) in 0.004 seconds

   Ordered by: cumulative time

   ncalls  tottime  percall  cumtime  percall filename:lineno(function)
  13529/1    0.004    0.000    0.004    0.004 /app/app.py:21(fibonacci)
        1    0.000    0.000    0.000    0.000 {method 'disable' of '_lsprof.Profiler' objects}
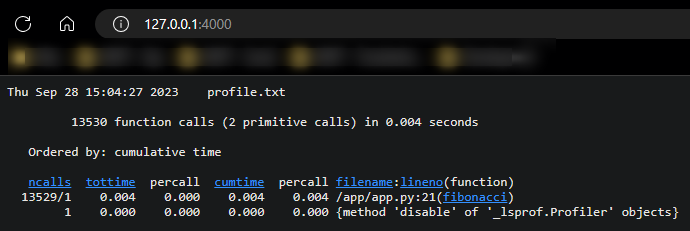
Using cprofilev to view file output
If you try to directly open the profile file - it will likely not display properly. Instead, you can use this cprofilev to view this in a browser.
- Install the library with
pip install cprofilev - Run the command against the profile file - eg.,
cprofilev -f profile.txt - This will now listen at
http://127.0.0.1:4000. Open a tab to that address on your local machine - this should look something like the following:
For definitions on ncalls, percall, and others - view Instant User’s Manual
cProfile analysis
In order to review a cProfile output, you will need to understand the structure of the output:
- function calls in time - The first line indicates the number of calls that were monitored. How many calls were primitive, meaning that the call was not induced via recursion and the time in seconds.
- ordered by - If you don’t specify any parameter it will take the standard name.
Then you will find several columns:
- ncalls. Number of calls for that specific line of code.
- tottime. Total time spent in the function (and excluding the time made in calls to sub-functions)
- percall. This is the result of dividing tottime by ncalls.
- cumtime. Cumulative time spent in this and all subfunctions (from invocation till exit)
- percall. This is the result of dividing cumtime by primitive calls.
- filename:lineno(function) - Data of each function profiled.
pyinstrument
pyinstrument is a profiler focused on showing the callstack from script execution. You can generally either print the output of the profile to stdout/console - or - render this into an .html file.
To view how pyinstrument works in terms of profiling, review the how it works section.
NOTE: If deciding to render this into an .html file for viewing and this is on Container Apps - this could pose security risks, depending on the logic of your application. Considering locking down application traffic to well-known traffic, if the Container App Environment is in a VNET.
- To install this library run the following:
pip install pyinstrument
- Import the package as seen below:
from pyinstrument import Profiler
- To profile your code, use the following methods imported from
profiler. The below example uses Flask - consult the User Guide for more specific usage with Flask and other frameworks:
from pyinstrument import Profiler
profiler = Profiler()

@route('/')
def index():
    profiler.start()
    # ... defined chunk of code to profile ...
    # ... defined chunk of code to profile ...
    profiler.stop()
    print(profiler.output_text(unicode=True, color=True))
    return jsonify({"message": "Running Fibonacci sequence.."})
Depending on the logic being profiled, application would generally look something like the below:
2023-09-29T17:29:05.610219985Z   _     ._   __/__   _ _  _  _ _/_   Recorded: 17:29:05  Samples:  3
2023-09-29T17:29:05.610229984Z  /_//_/// /_\ / //_// / //_'/ //     Duration: 0.004     CPU time: 0.004
2023-09-29T17:29:05.610257656Z /   _/                      v4.5.3
2023-09-29T17:29:05.610264369Z
2023-09-29T17:29:05.610270941Z Program: /usr/local/bin/gunicorn -b 0.0.0.0:8000 app:app --timeout 600 --access-logfile - --error-logfile -
2023-09-29T17:29:05.610276241Z
2023-09-29T17:29:05.610281300Z 0.003 fib_console  app.py:11
2023-09-29T17:29:05.610286540Z └─ 0.003 fibonacci  app.py:16
2023-09-29T17:29:05.610291720Z    └─ 0.003 fibonacci  app.py:16
2023-09-29T17:29:05.610296609Z       └─ 0.003 fibonacci  app.py:16
2023-09-29T17:29:05.610302430Z          └─ 0.003 fibonacci  app.py:16
2023-09-29T17:29:05.610308010Z             └─ 0.003 fibonacci  app.py:16
2023-09-29T17:29:05.610313641Z                └─ 0.003 fibonacci  app.py:16
2023-09-29T17:29:05.610318981Z                   └─ 0.003 fibonacci  app.py:16
2023-09-29T17:29:05.610324081Z                      └─ 0.003 fibonacci  app.py:16
2023-09-29T17:29:05.610329451Z                         └─ 0.003 fibonacci  app.py:16
2023-09-29T17:29:05.610335392Z                            └─ 0.003 fibonacci  app.py:16
2023-09-29T17:29:05.610341283Z                               └─ 0.003 fibonacci  app.py:16
2023-09-29T17:29:05.610346633Z                                  └─ 0.003 fibonacci  app.py:16
2023-09-29T17:29:05.610351853Z                                     ├─ 0.002 fibonacci  app.py:16
2023-09-29T17:29:05.610357574Z                                     │  ├─ 0.001 fibonacci  app.py:16
2023-09-29T17:29:05.610362723Z                                     │  └─ 0.001 [self]  app.py
2023-09-29T17:29:05.610367562Z                                     └─ 0.001 [self]  app.py
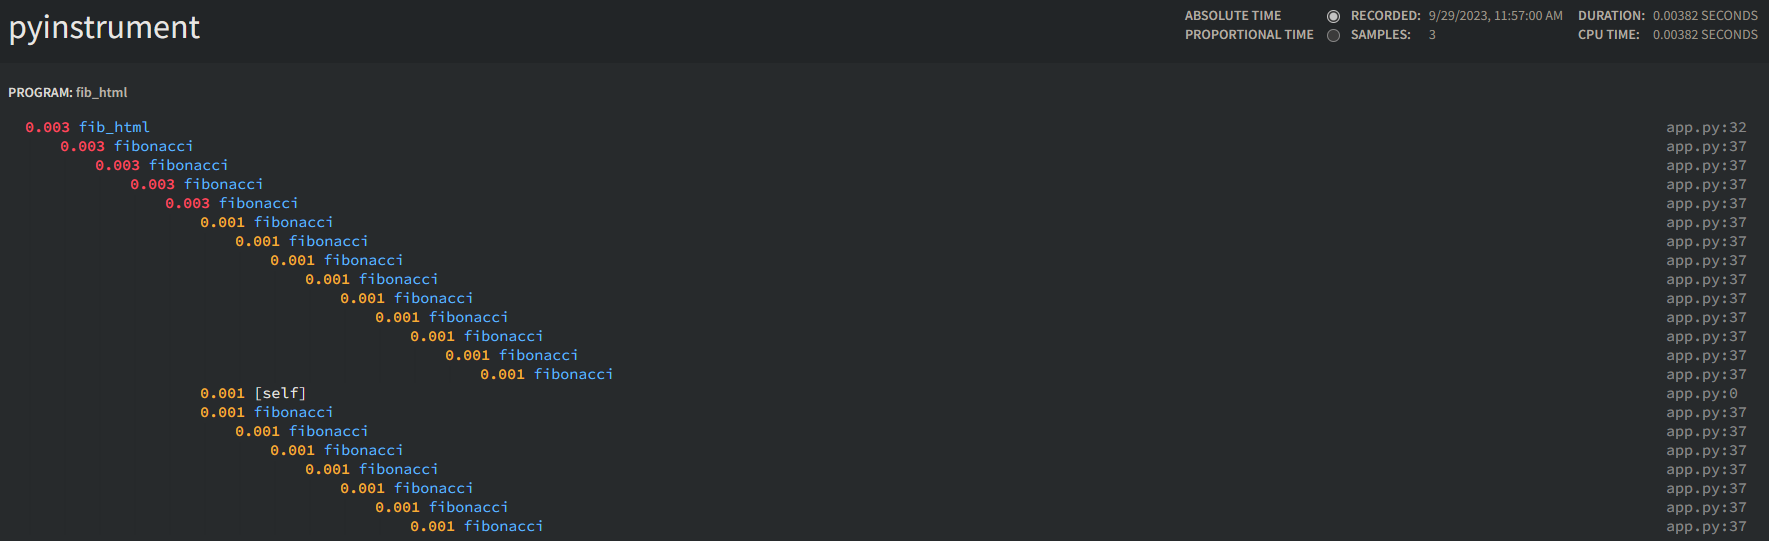
If you instead want to render this into an .html page, you’ll need to change your code to the below - for web frameworks, like Django, Flask, and others - the return value of the function would need to be the .html page being rendered:
This snippet is using Flask
profiler.stop()
p = profiler.output_html("profile.html")
return p
The output would look like this:
Examples of using pyinstrument with various web frameworks can be found in the User Guide:
Analyzing pyinstrument output
Some notable output from pyinstrument is as follows:
- Duration: Time it took to profile the program - eg., 0.004
- CPU time: CPU time spent with the program - 0.004
- Program: The executable that started the program - eg.,
/usr/local/bin/gunicorn -b 0.0.0.0:8000 app:app --timeout 600 --access-logfile - --error-logfile -
0.003 fib_console  app.py:11
└─ 0.003 fibonacci  app.py:16
    └─ 0.003 fibonacci  app.py:16
The first row (0.003), indicates time spent on that particular function. This is followed by the function name, and then the location of the function in reference to source code. The above example points to functions named fib_console in app.py on line 11 and finbonacci in app.py on line 16.
For a good walkthrough of pyinstrument and interpreting the output, review calmcode.io - pyinstrument: scripts
Other profilers
Below is a list of other potential profilers to use, that were not covered more specifically above.
High Memory
tracemalloc
tracemalloc, like cProfile, is a part of the python standard library.
From the tracemalloc documentation:
The tracemalloc module is a debug tool to trace memory blocks allocated by Python. It provides the following information:
- Traceback where an object was allocated
- Statistics on allocated memory blocks per filename and per line number: total size, number and average size of allocated memory blocks
- Compute the differences between two snapshots to detect memory leaks
- To use tracemalloc, import the package:
import tracemalloc
- Then add code for it - this example takes a snapshot of memory used and uses a loop to output the top 10 consumers of memory. Use
tracemallocin the parts of your program that is potentially causing memory issues.
@app.route("/mem")
def fib():
    tracemalloc.start()

    for i in range(100):
        o = [0] * i

    snapshot = tracemalloc.take_snapshot()
    top_stats = snapshot.statistics('lineno')
    print("[ Top 10 ]")
    for stat in top_stats[:10]:
        print(stat)

    return jsonify({"message": "Allocating memory.."})
Basic output from this would look like:
[ Top 10 ]
/app/app.py:39: size=792 B, count=1, average=792 B
/app/app.py:41: size=416 B, count=1, average=416 B
You can additionally use the display_top (pretty top) function here to try and pretty-print the output, which would look like the below - note, that this output will vastly differ based on your application and logic:
 Top 10 lines
 #1: /usr/local/lib/python3.10/linecache.py:137: 337.2 KiB
     lines = fp.readlines()
 #2: /usr/local/lib/python3.10/tracemalloc.py:67: 14.6 KiB
     return (self.size, self.count, self.traceback)
 #3: /usr/local/lib/python3.10/tracemalloc.py:193: 11.6 KiB
     self._frames = tuple(reversed(frames))
 #4: /usr/local/lib/python3.10/abc.py:123: 2.7 KiB
     return _abc_subclasscheck(cls, subclass)
 #5: /usr/local/lib/python3.10/site-packages/werkzeug/routing/matcher.py:116: 2.4 KiB
     rv = _match(state.static[part], parts[1:], values)
 #6: /usr/local/lib/python3.10/site-packages/gunicorn/http/wsgi.py:154: 2.2 KiB
     environ['REMOTE_PORT'] = str(client[1])
 #7: /usr/local/lib/python3.10/site-packages/gunicorn/http/message.py:106: 1.8 KiB
     value = ''.join(value).rstrip()
 #8: /usr/local/lib/python3.10/site-packages/gunicorn/http/wsgi.py:136: 1.8 KiB
     key = 'HTTP_' + hdr_name.replace('-', '_')
 #9: /usr/local/lib/python3.10/site-packages/gunicorn/http/message.py:92: 1.6 KiB
     name = name.upper()
 #10: /usr/local/lib/python3.10/tracemalloc.py:558: 1.4 KiB
     traces = _get_traces()
 242 other: 84.2 KiB
 Total allocated size: 461.5 KiB
In the “pretty printed” method, we can see a more specific function call location - including file and line number. This includes memory used per-function displayed in more human readable format.
So far, all of the above writes to the console/stdout. If you wanted to write to a specific file, use the snapshot.dump method.
snapshot.dump("/app/profiles/snap.out")
To be able to download this for later viewing, make sure that the path specified in dump() is pointing to a mounted volume path as described earlier in this blog post.
memray
memray is a Python memory profiler developed by Bloomberg. This library can track memory allocations in Python-based code as well as native code (C/C++), which can help with certain Python libraries that rely on native code or modules.
NOTE: memray does not work directly on windows, but will work in containerized or WSL2 environments on Windows. See below on ways to view generated output.
- Install the library:
pip install memray
-
You can directly invoke
memrayin your startup command for consistent profiling.- 2a - Using this on an application using a wSGI server like gunicorn:
memray run --follow-fork -o /app/profiles/profile.bin -m gunicorn app:app -b 0.0.0.0:8000 --timeout 600 --access-logfile "-" --error-logfile "-"-
--follow-forkfollows forked/children processes to track memory allocation. This is needed in gunicorn usage where there is a master process and then potential multiple workers. See How to use memray with Gunicorn and Django? #56 -
2b - Using this directly against a
.pyfile:
memray run -o /app/profiles/profile.bin -m python app.py
Writing to a file or location:
The -o flag is used to tell memray where to write the profile files to. Note, specifying a name like profile.bin will potentially generate a new profile roughly every x seconds with a new file depending on the application load and how fast the files fill up in size. Eg., profile.bin, profile.bin.9, profile.bin.18. These are all readable profile files.
In certain cases, many profile files may be generated. Using something like Azure Storage Explorer may be good to manage these profile files.
NOTE: If you try to write to an already existing file (such as when restarting an app but
someprofile.binalready exists, it will throwCould not create output file /some/path/profile.bin: File exists- this will cause the container to crash - take care that prior profiles are deleted upon restarting if not using unique naming.
To get around the issue of potential container crashes - in your ENTRYPOINT or a custom startup script - use an approach like the following approach:
PROFILE_FILE=$(date "+%d-%b-%Y-%H:%M")-profile.bin

memray run --follow-fork -o /app/profiles/$PROFILE_FILE -m gunicorn app:app -b 0.0.0.0:8000 --timeout 600 --access-logfile "-" --error-logfile "-"
# or memray run -o /app/profiles/$PROFILE_FILE -m python app.py
$PROFILE_FILE will create a profile file in the format of dd-mm-yy-mm:hh.profile.bin - to keep the file generally unique in name.
Analyzing output
IMPORTANT: memray does not work on Windows. If testing in a containerized or WSL2 based environment - run a container with a mount option from your local machine - (ex., docker run -d -p 8000:8000 -v "%cd%"\profiles:/app/profiles container-apps-python-profilers-memray:latest) - in the container you can generate the below reports to view as tabular or .html format.
memray summary
memray summary [profile_file.bin] provides a nice tabular and easy to read output when ran against a profile file. Below is an example - we can see that function calls (highlighted) make_two_arrays() at /app/app.py and the numpy method np.ones is allocating and using the most out of the ones in this output.
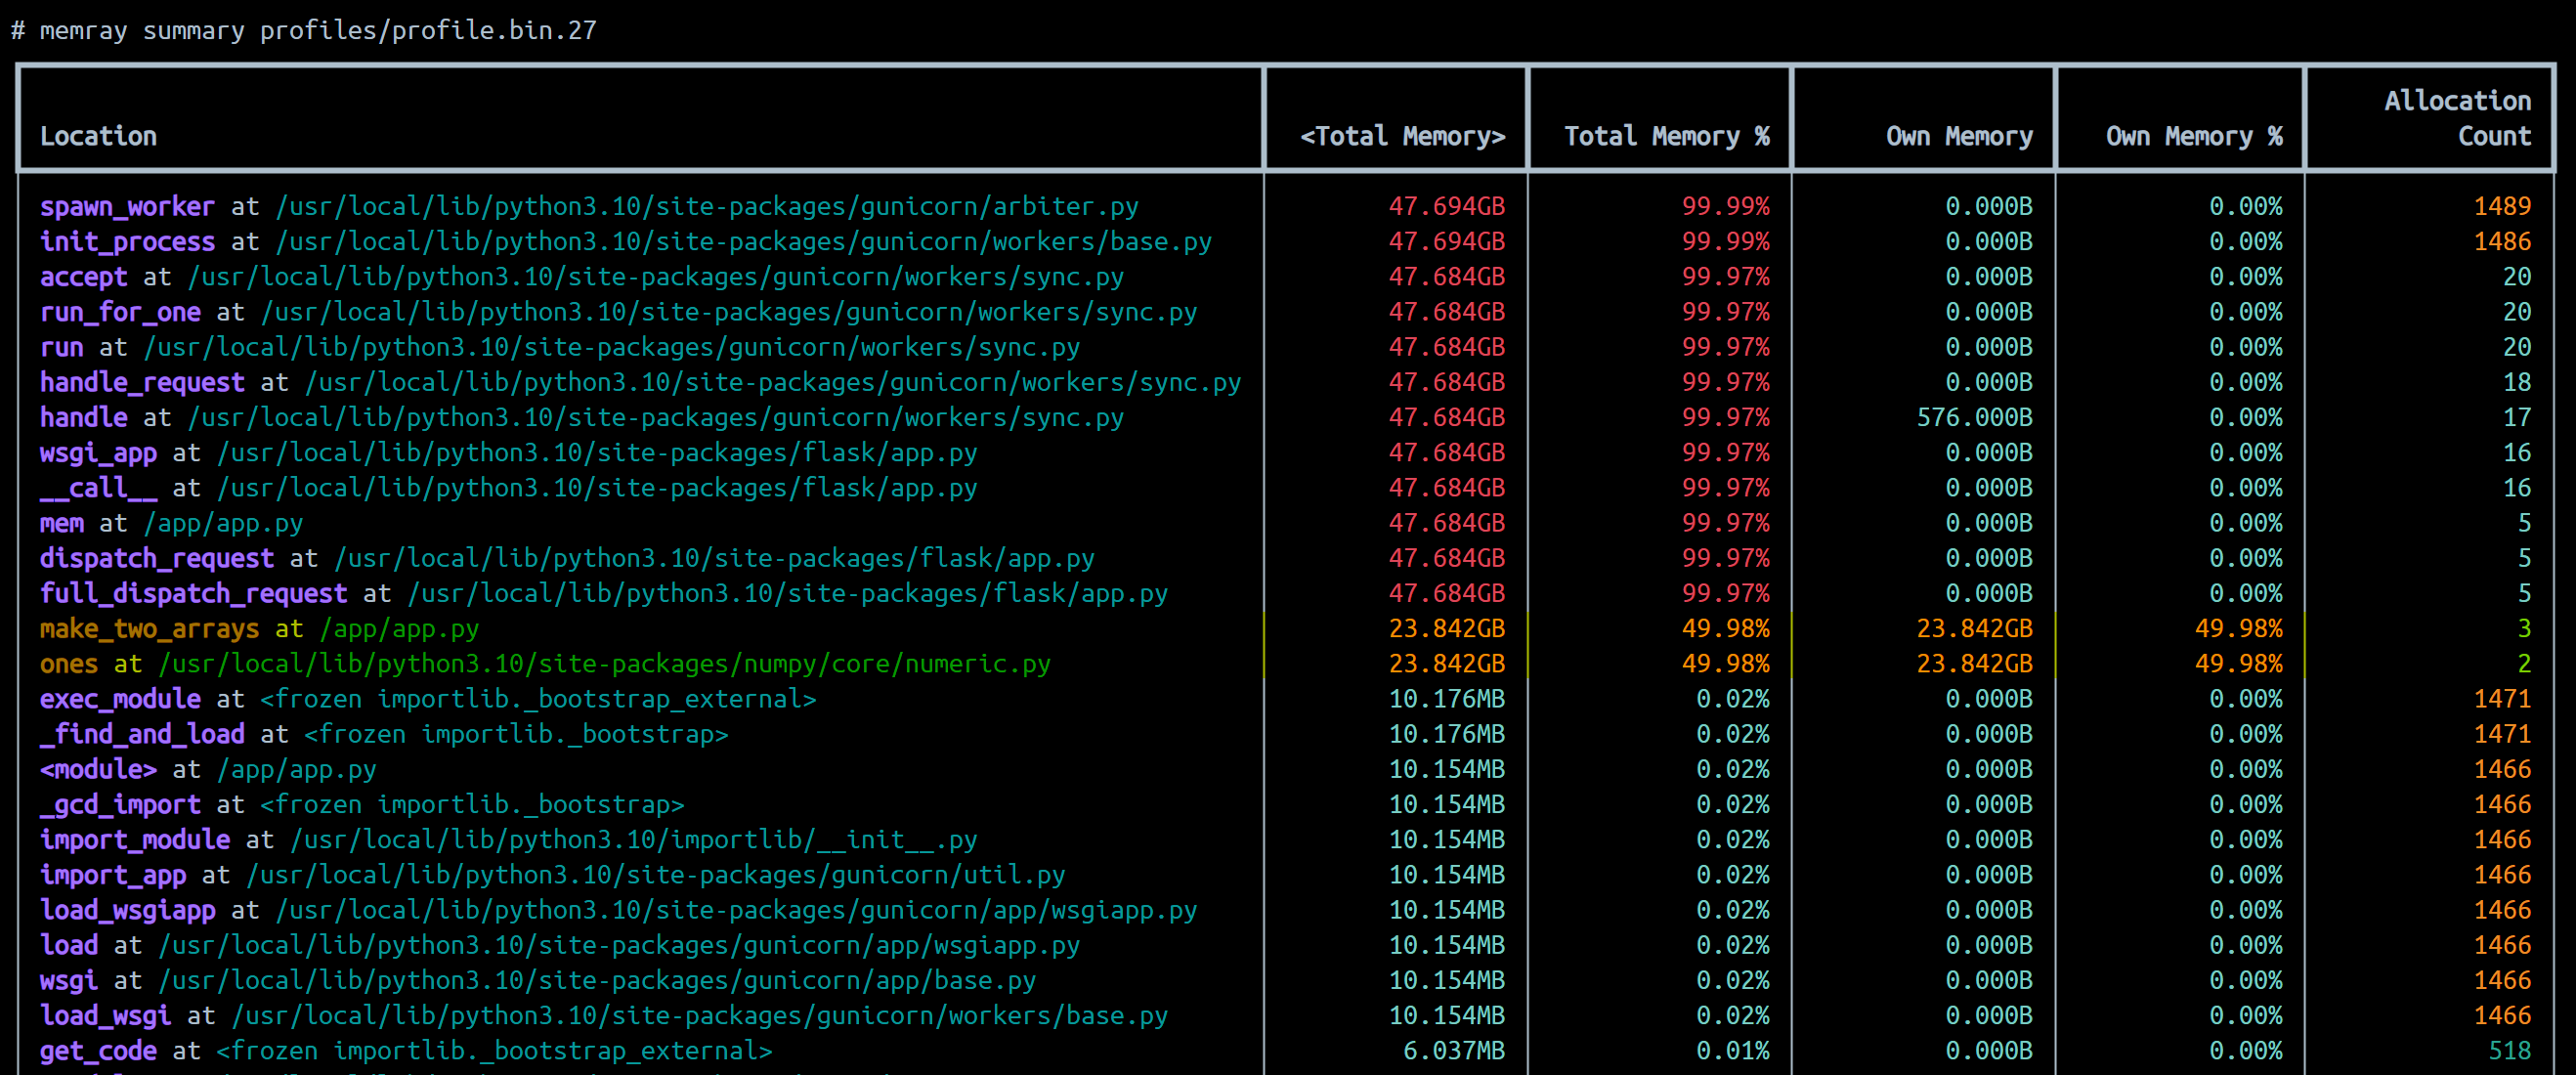
For more documentation on summary reporter usage, see memray - summary reporter.
memray flamegraph
You can generate a flamegraph with the memray flamegraph [profile_file.bin] command. This will create an .html file in the name of meray-flamegraph-[nameofprofilefile].bin.html. You can then view this locally in your browser or through a IDE browser extension.
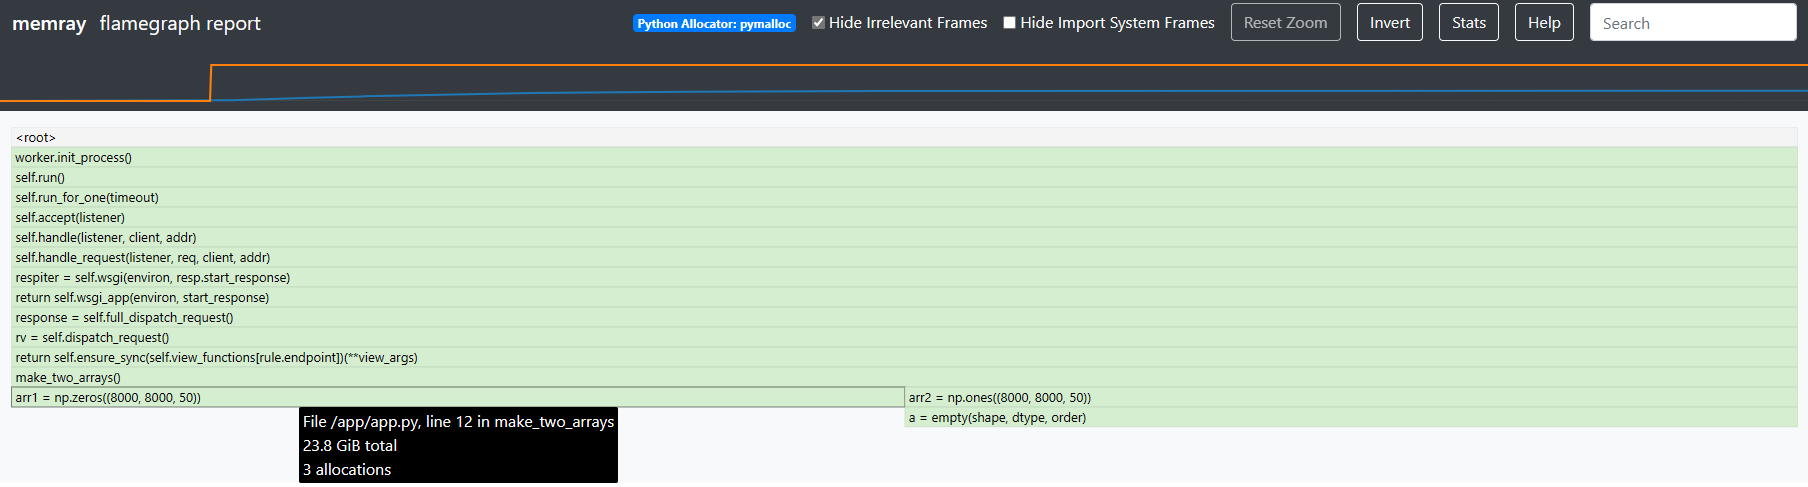
You can click on the top portion of the page which represents heap and RSS size at the time of profiling. This will open a modal with a more defined with:
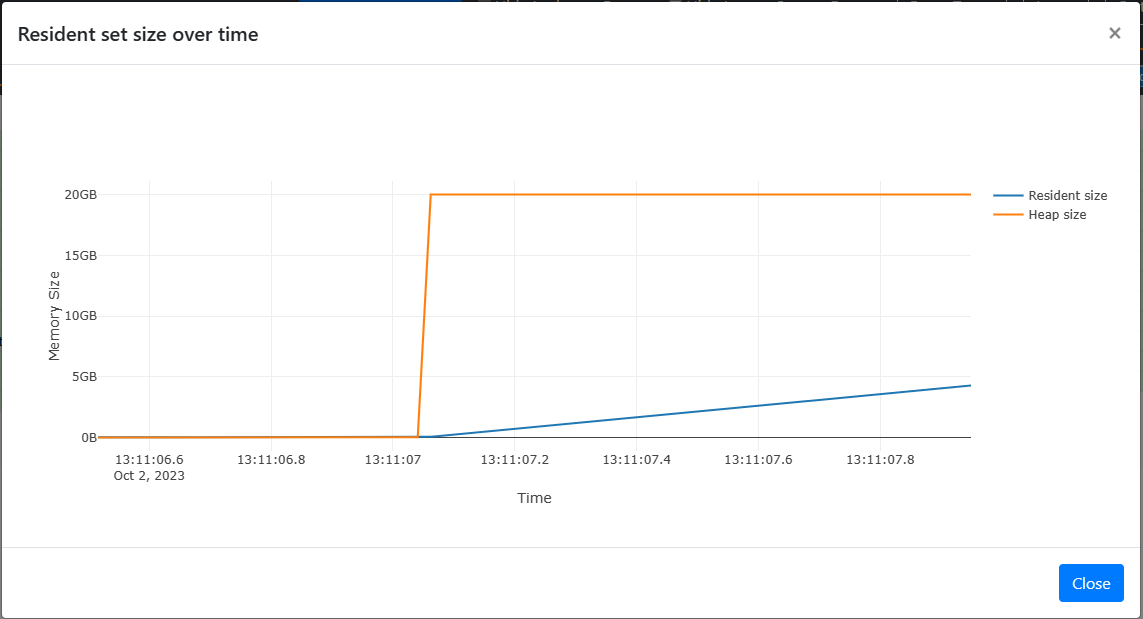
For more documentation on memray flamegraph usage and how to interpret the flamegraph, see memray - flamegraph.
Other memory profile tooling
- guppy3
- pympler
- scalene
- mempry_profiler (deprecated, but has easy to read tabular output)
Application Performance Monitoring tools (APM’s) and Observability
There are third-party tools that can also be used - the majority of these tools are not free, but the advantage can be huge, since these tools are specifically designed to gather extra information and present it in an understandable way for memory, cpu, and other scenarios.
You can find the most common APMs for Python:


