Container Apps: Profiling Node applications for performance issues
This post will cover using troubleshooting tools to help profile performance issues on Container Apps with Node applications.
Overview
Sometimes, applications may encounter issues due to poor performance - either high CPU usage, high memory (or out of memory), generally slow performance due to code execution logic, or others.
In these scenarios, if it’s been determined this is likely an application problem, you can use troubleshooting tooling to profile or take dumps of the application.
This post will explain how to view or download profile/dump files - and show a few libraries that can be used to help with CPU and/or memory profiling/dumps.
Note, that this post does not cover any specific web framework or web library in terms of Node Web-based applications. The packages discussed in this post are in terms of generalized usage.
Important Prerequisites
Some important prerequisites is to be able to:
- Being able to connect to the container through the Console blade or use the
az containerapp execcommand. See console documentation here - Able to download files from the container
There is no out-of-the-box method to profile/generate a dump for an application container on Container Apps. To understand if there is application slowness, either due to high CPU, high memory, dependency problems, or other reasons - a profiler typically specific to the language/runtime you’re using should be used.
In the case of Node - most profilers are installed as packages and used through code. This should be validated and tested locally to ensure this works before testing on Container Apps.
Console access
You can use either the Azure CLI or the portal for console access. Below is what portal access would look like:
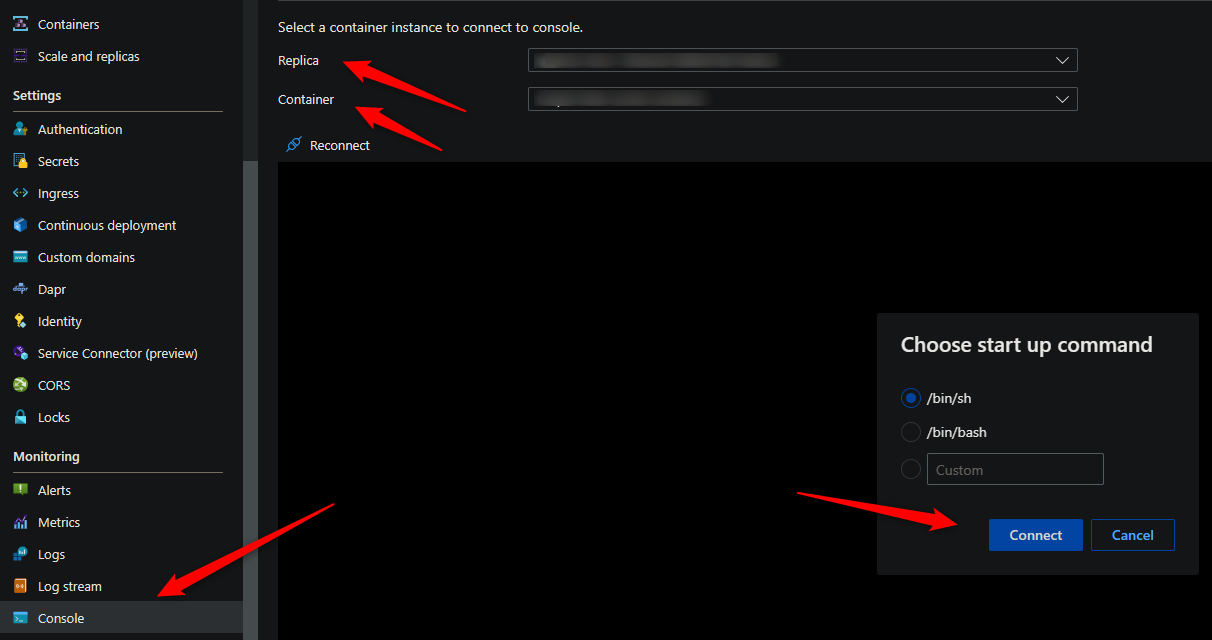
These commands for capturing profiles and dumps require access to a terminal - so console access is required.
Download files from the container
You’ll need a way to download files from the container. By default, there is no way to get files generated at runtime by a container in Container Apps without some additional configuration.
The most simplistic way is to mount a volume from an Azure File Share with an Azure Storage Account.
For a quickstart on how to add a volume, follow Use storage mounts in Azure Container Apps
NOTE: It is advised to add this mount before testing or generating files. If you do this after testing (and in single revision mode, for instance) then a new pod will be created and previous files would be lost.
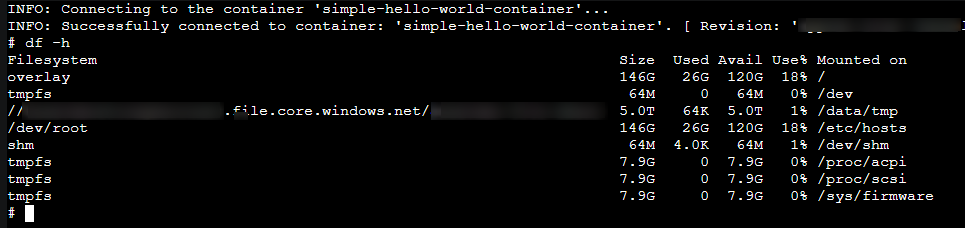
You can validate that the volume is mounted with the df -h command:
Determining high CPU or memory
Diagnose and Solve problems
You can use the following detectors in the Diagnose and Solve Problems blade to diagnose these issues:
- Container App Memory Usage
- Container App CPU usage
Metrics blade
You can use the following metric breakdowns in the Metrics blade to diagnose these issues:
- CPU usage
- Memory Working Set Bytes
- Reserved Cores
- Total Reserved Cores
cgroupv2 change
See this GitHub issue - Mitigate Potential Memory Pressure Effects With cgroup v2 - With the change for cgroupv2 from cgroupv1 can introduce unexpected memory management issues for applications. From what is mentioned on this post - Node v20.3.0 contains a PR to address cgroupv2 support.
Generating dumps or profiling
Best practices
When taking a heap dump, thread dump, or profiling - it is recommended to take a few of these while reproducing the issue for consistent data.
Taking only (1) may show data that is ultimately not relevant - taking multiple of these will show a more consistent theme in terms of what the problem may be - and would be easier to troubleshoot.
There are times when taking multiple dumps/profiles, you may notice one has a variation of data - if this happened to be the one dump/profile you took (if only taking one total), this can cause the investigation to go down the wrong path.
NOTE: When profiling an application, there is the chance this creates further negative performance impact (while profiling is occurring). This should be noted, especially for production environments.
High CPU
v8-profiler-next
The v8-profiler-next package can be installed to profile node applications for CPU consumption. This package supports Node 12.x up to Node 20.x currently (this is mentioned in the README.md here, but not on npm’s site).
NOTE: v8-profiler-node8 also can be used, which has much of the same syntax as
v8-profiler-next- however, it currently supports up to Node 18.x.
- Install the package by using yarn or npm:
yarn add v8-profiler-nextornpm i v8-profiler-next
-
Add the profiler within your codebase. Place this in an area where profiling is needed - below is an example:
 const v8Profiler = require("v8-profiler-next");
 ..other imports..

 const fibonacciController = router.get("/", (_req, res) => {
     const title = "nodeprofile";
     v8Profiler.setGenerateType(1);
     v8Profiler.startProfiling(title, true);

     try {
         const rand = Math.floor(Math.random() * 89) + 1;
         console.log(rand);
         const fibo = (n) => {
             if (n < 2) {
                 return 1;
             }
             else return fibo(n - 2) + fibo(n - 1)
         }

         fibo(rand)

         const profile = v8Profiler.stopProfiling(title);
         profile.export((_error, result) => {
             fs.writeFileSync(`/app/profiles/${title}.cpuprofile`, result);
             profile.delete();
         });

         res.json({ "msg": "Executing fibonacci sequence.. " })
     } catch (error) {
         console.error(error)
         res.json({ "err": error })
     }
 })
In the above example, the
titlevariable will be the name of the.cpuprofilewritten. This would be written asnodeprofile.cpuprofile.
Make sure to write this into the mounted volume directory for persistence that was specified earlier.
Important: Users running an Alpine distribution may encounter SIGSEV (segmentation fault) when profile.export() is invoked. If a distro like Debian or others cannot be use, consider using node --cpu-prof or --prof instead.
node –cpu-prof
Nodes builtin V8 CPU profiler, --cpu-prof can be used in profiling application performance issues.
To write this to the location specific in the volume mount, use the --cpu-prof-dir argument. A full fledged command may look like the below:
node --cpu-prof-dir "/app/profiles" --cpu-prof /usr/src/app/server.js
- You can additionally give profiles custom names with the
--cpu-prof-nameargument - If you want to change the default profiling interval, which is set to a default of 1000 microseconds - use the
--cpu-prof-intervalargument in microseconds.
Although the documentation mentions this will write to disk after exit - it may require a bit more work to get the profile written out to disk. There are a few options:
-
Try to handle signals passed in from the Console, such as
SIGUSR1/SIGUSR2. Use something like the below in your.jsentrypoint to appropriately catch this signal:process.on("SIGUSR1", (code) => { if (code === "SIGUSR1") { console.log("SIGUSR1 received.."); process.exit(0); } }); -
Or, make a controller/endpoint that calls
process.exit(0);router.get("/", (_req, _res, _next) => { console.log("Exiting process..") process.exit(0) }); -
Using the below code, restart the replica - go to the Azure Portal -> Revisions -> Click on the revision -> “Restart” - this should catch the
SIGTERMsignal sent, which will callprocess.exit(0)and should write out the profile to the specified location.process.on("SIGTERM", (code) => { if (code === "SIGTERM") { console.log("SIGTERM received.."); process.exit(0); } });NOTE: You may need to
trapthe signal in yourENTRYPOINT
After the file is written, it would look something like like: CPU.20231017.190830.1.0.001.cpuprofile
You can download the *.cpuprofile generated file and use Chrome/Edge to analyze it. In Chrome browser chrome://inspect/, or, with Edge edge://inspect, and then click on Open dedicated DevTools for Node. Then select the Performance tab and load the *.cpuprofile file.
Reading CPU profiles
In Chromium browsers
For documentation on the Performance tab used below - see Chrome - Devtools - Performance - Reference
Since Chrome and Edge Browsers (Chromium) uses the same JavaScript runtime (V8 engine), profiler traces can be read using Chrome or Edge DevTools for Node.
- Chrome: Navigate in Chrome Browser and type
chrome://inspect/, then click in Open dedicated DevTools for Node - Edge: Navigate in Chrome Browser and type
edge://inspect/, then click in Open dedicated DevTools for Node
You can load a CPU profile here and analyze it. You will find columns as Self Time, Total Time, Function (File location) as well as Chart and Trees.
Self Time: Represents the amount of time spent in the function at the current level of a call tree.
Total Time: It is the self time + the amount of time it took to execute the code in functions that the current level calls.
Ideally, we’d be looking here for the function that has a high self time. A function may have high self time because it is called numerous times (such as recursively) - or taking a long time to execute due to programmatic/logic reasons.
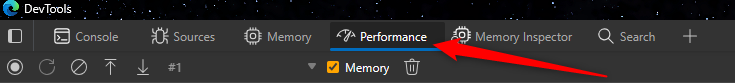
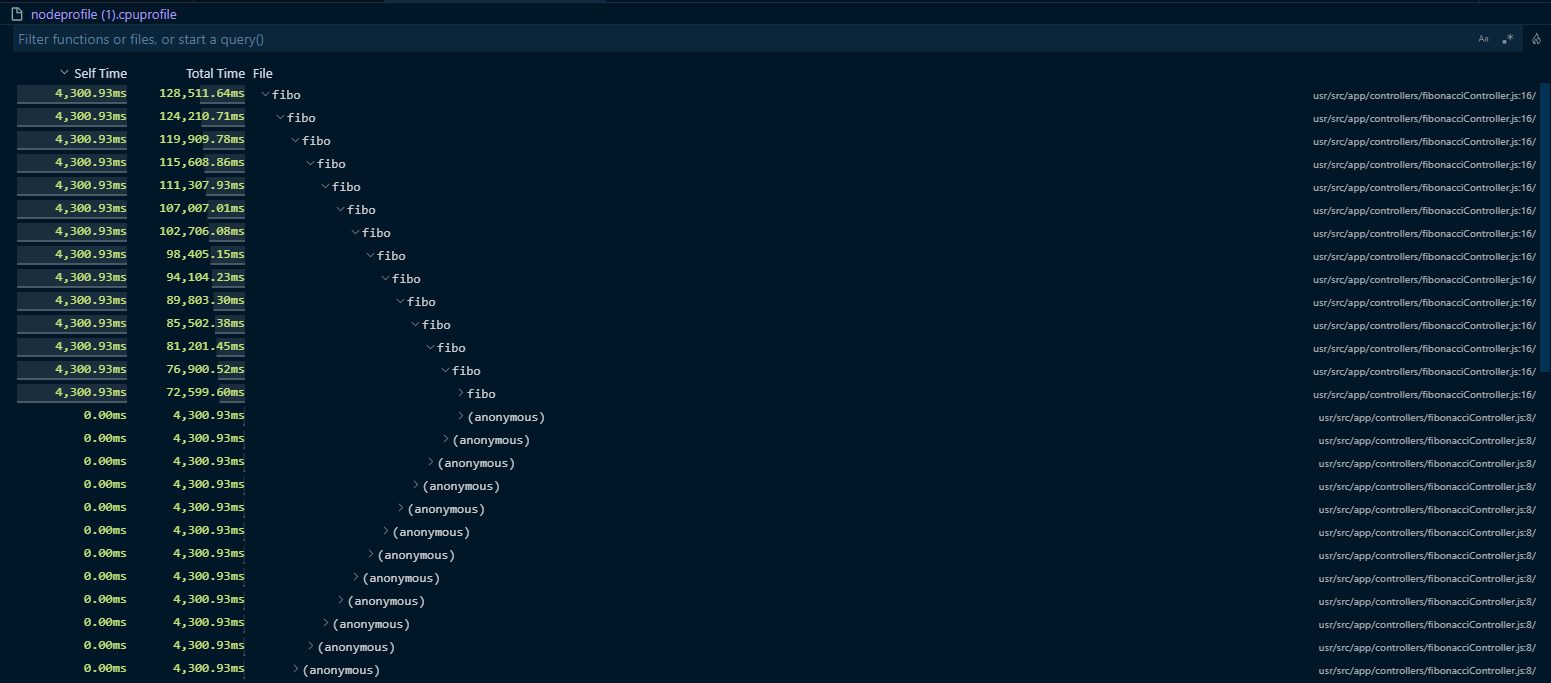
To load a profile into the DevTools view - go to the Performance tab and then either load-in or drag-and-drop the .cpuprofile wanting to be viewed:
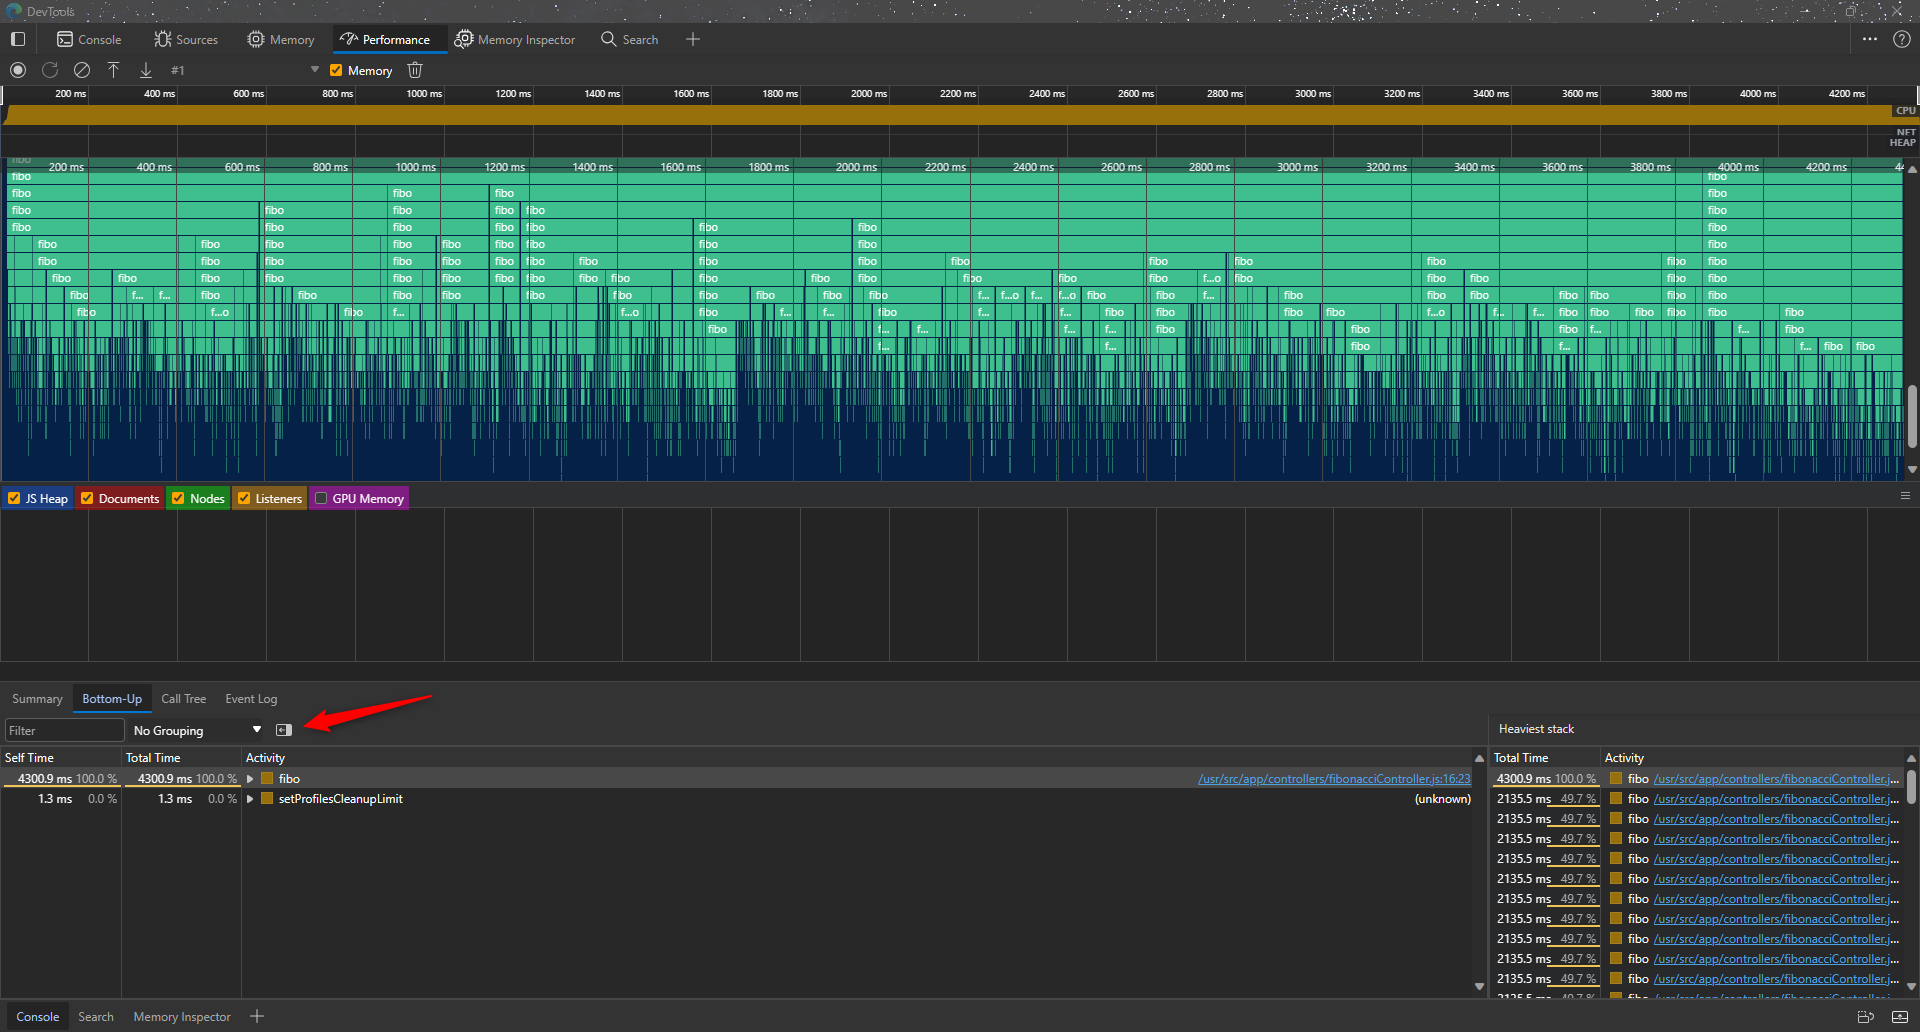
- The view below shows a flamegraph-type view. Each box corresponds to a function call - which can be clicked into and drilled down in the other views like “bottom up” and “call time”.
- These can also be hovered over which will show the invoked functions name and the time spent on self.
- The arrow points to “show heaviest call stack” - The Heaviest Stack table shows you which children of the selected activity took the longest time to execute.
VSCode
You can read .cpuprofile files through Visual Studio Code. Additional documentation on how to view profiles can be found here - VSCode - nodejs - profiling.
NOTE: You can view these profiles in a flamegraph by installing the extension VSCode JS Profile Flame - the “flame” icon in the bottom right screenshot view will take you there in VSCode automatically if this is not installed
You can either load in the file through the File option or just drag-and-drop it into the current working VSCode session. Then, simply open the file.
Notable columns include:
- Self time: Shows how much time was spent only inside a function itself without taking into account its child nodes.
- Total time: Shows how much time was spent inside a function and the functions it called.
The far right file paths is where these functions were invoked from.
High Memory
v8-profiler-next
You can also use the v8-profiler-next package to take heap dumps.
NOTE: v8-profiler-node8 also can be used, which has much of the same syntax as
v8-profiler-next- however, it currently supports up to Node 18.x.
- Install the package by using yarn or npm:
yarn add v8-profiler-nextornpm i v8-profiler-next
-
Add the profiler within your codebase. Place this in an area where profiling is needed - below is an example:
 const memoryLeakController = router.get("/", (_req, res) => {
     try {
         bigObjects()
         const snapshot = v8Profiler.takeSnapshot();

         snapshot.export((error, result) => {
             if (error) {
                 console.error(error);
                 return;
             }
             fs.writeFileSync("/app/profiles/heap.heapsnapshot", result);
             snapshot.delete();
         });

         res.json({ "msg": "Leaking memory.. " })
     } catch (error) {
         console.error(error)
         res.json({ "err": error })
     }
 })
Make sure to write this to the directory specified with the mounted volume.
Important: Users running an Alpine distribution may encounter SIGSEV (segmentation fault) when profile.export() is invoked. If a distro like Debian or others cannot be use, consider using node --heap-prof or --heapsnapshot-signal instead.
node –heap-prof
You can use nodes built-in v8 heap profiler –heap-prof.
Add this argument to your start command, such as node --heap-prof --heap-prof-dir "/app/profiles" /usr/src/app/server.js
Use --heap-prof-dir to point to this to the directory specified with the mounted volume, so the .heapprofile file can be downloaded for later.
This will generate a file that looks like Heap.20231019.230007.24.0.001.heapprofile.
This method will generate the heapprofile file on exit. Therefor, following the same guidance in the CPU profile section above would still apply, which is to first reproduce the issue, and then:
-
Pass a signal via Console. A simple approach is to use something like
kill -SIGUSR1 [pid]process.on("SIGUSR1", (code) => { if (code === "SIGUSR1") { console.log("SIGUSR1 received.."); process.exit(0); } });NOTE: You may need to
trapthe signal
The output file can be loaded into VSCode as well as DevTools for Chromium browsers. See the Reading heap profiles section below.
Alternatively, you can use node --heapsnapshot-signal - which accepts a signal to dump and create a .heapsnapshot file.
- eg.,:
node --heapsnapshot-signal=SIGUSR2 <entrypoint>.js
Reading heap profiles
heapsnapshots
Documentation on how to interpret heapsnapshot views in Chromium browsers can be found here - Chrome - Devtools - Heapsnapshot - Reference
Since Chromium Browsers (Chrome and Edge) uses the same JavaScript runtime (V8 engine), heap snapshots can be read using Chrome or Edge DevTools for Node.
- Chrome: Navigate in Chrome Browser and type
chrome://inspect/, then click in Open dedicated DevTools for Node - Edge: Navigate in Chrome Browser and type
edge://inspect/, then click in Open dedicated DevTools for Node
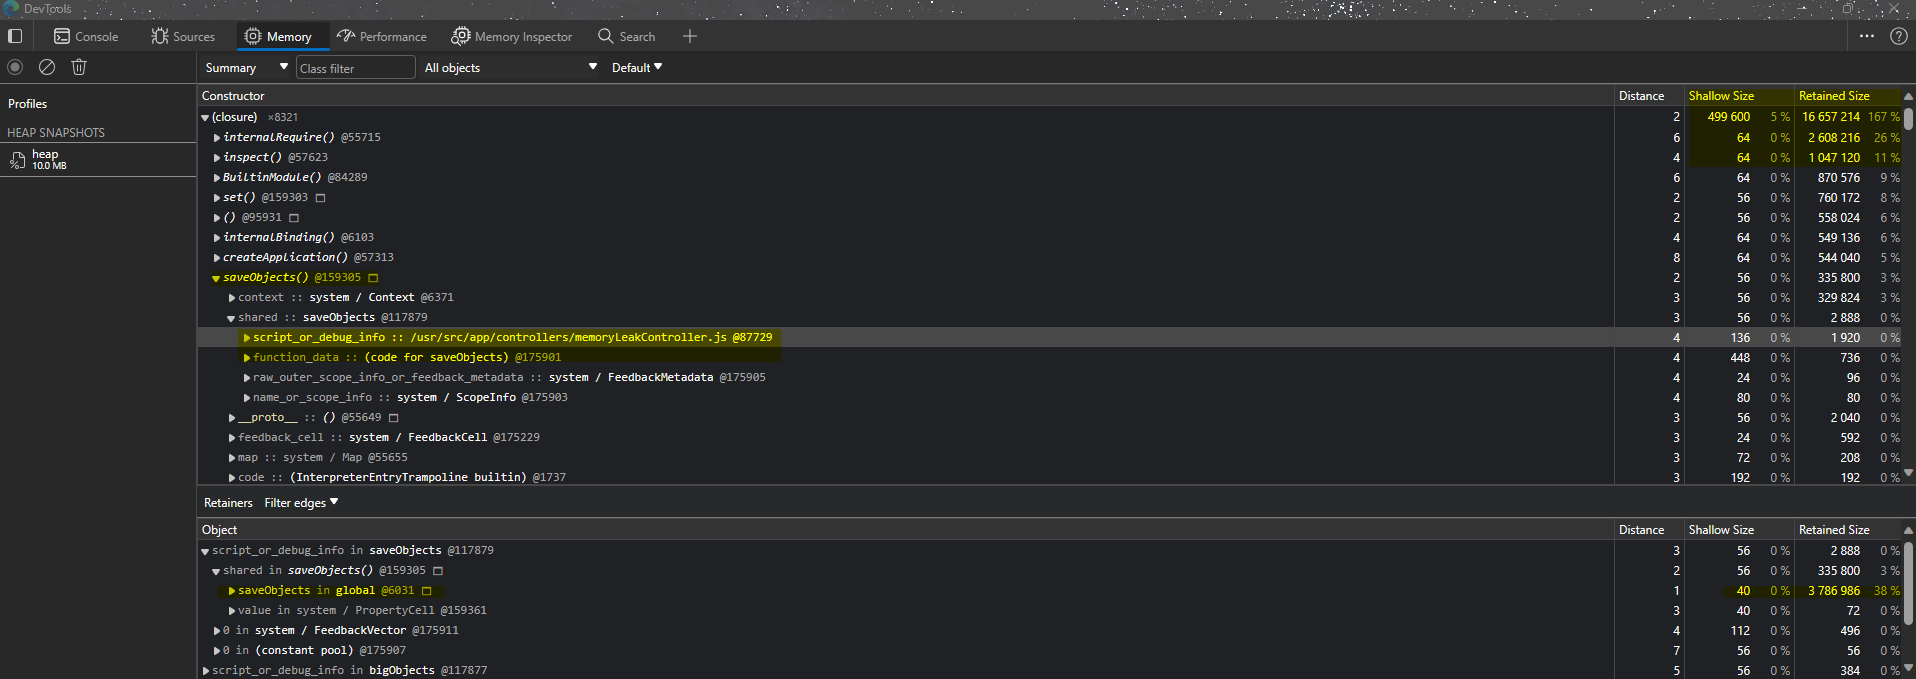
You can load a Heap Snapshot in the Memory and analyze it. You will find several columns, the most important ones are Shallow Size and Retained Size.
Shallow Size: This is the size of memory that is held by the object itself. Usually, only arrays and strings can have a significant shallow size.
Retained Size: This is the size of memory that is freed once the object itself is deleted due it becoming unreachable from GC roots. Held by object implicitly.
Typically, we’d be looking for the highest percentage in Retained Size as well with Shallow Size. Below is an example of looking at a breakdown of a function call with high retained size:
heapprofiles
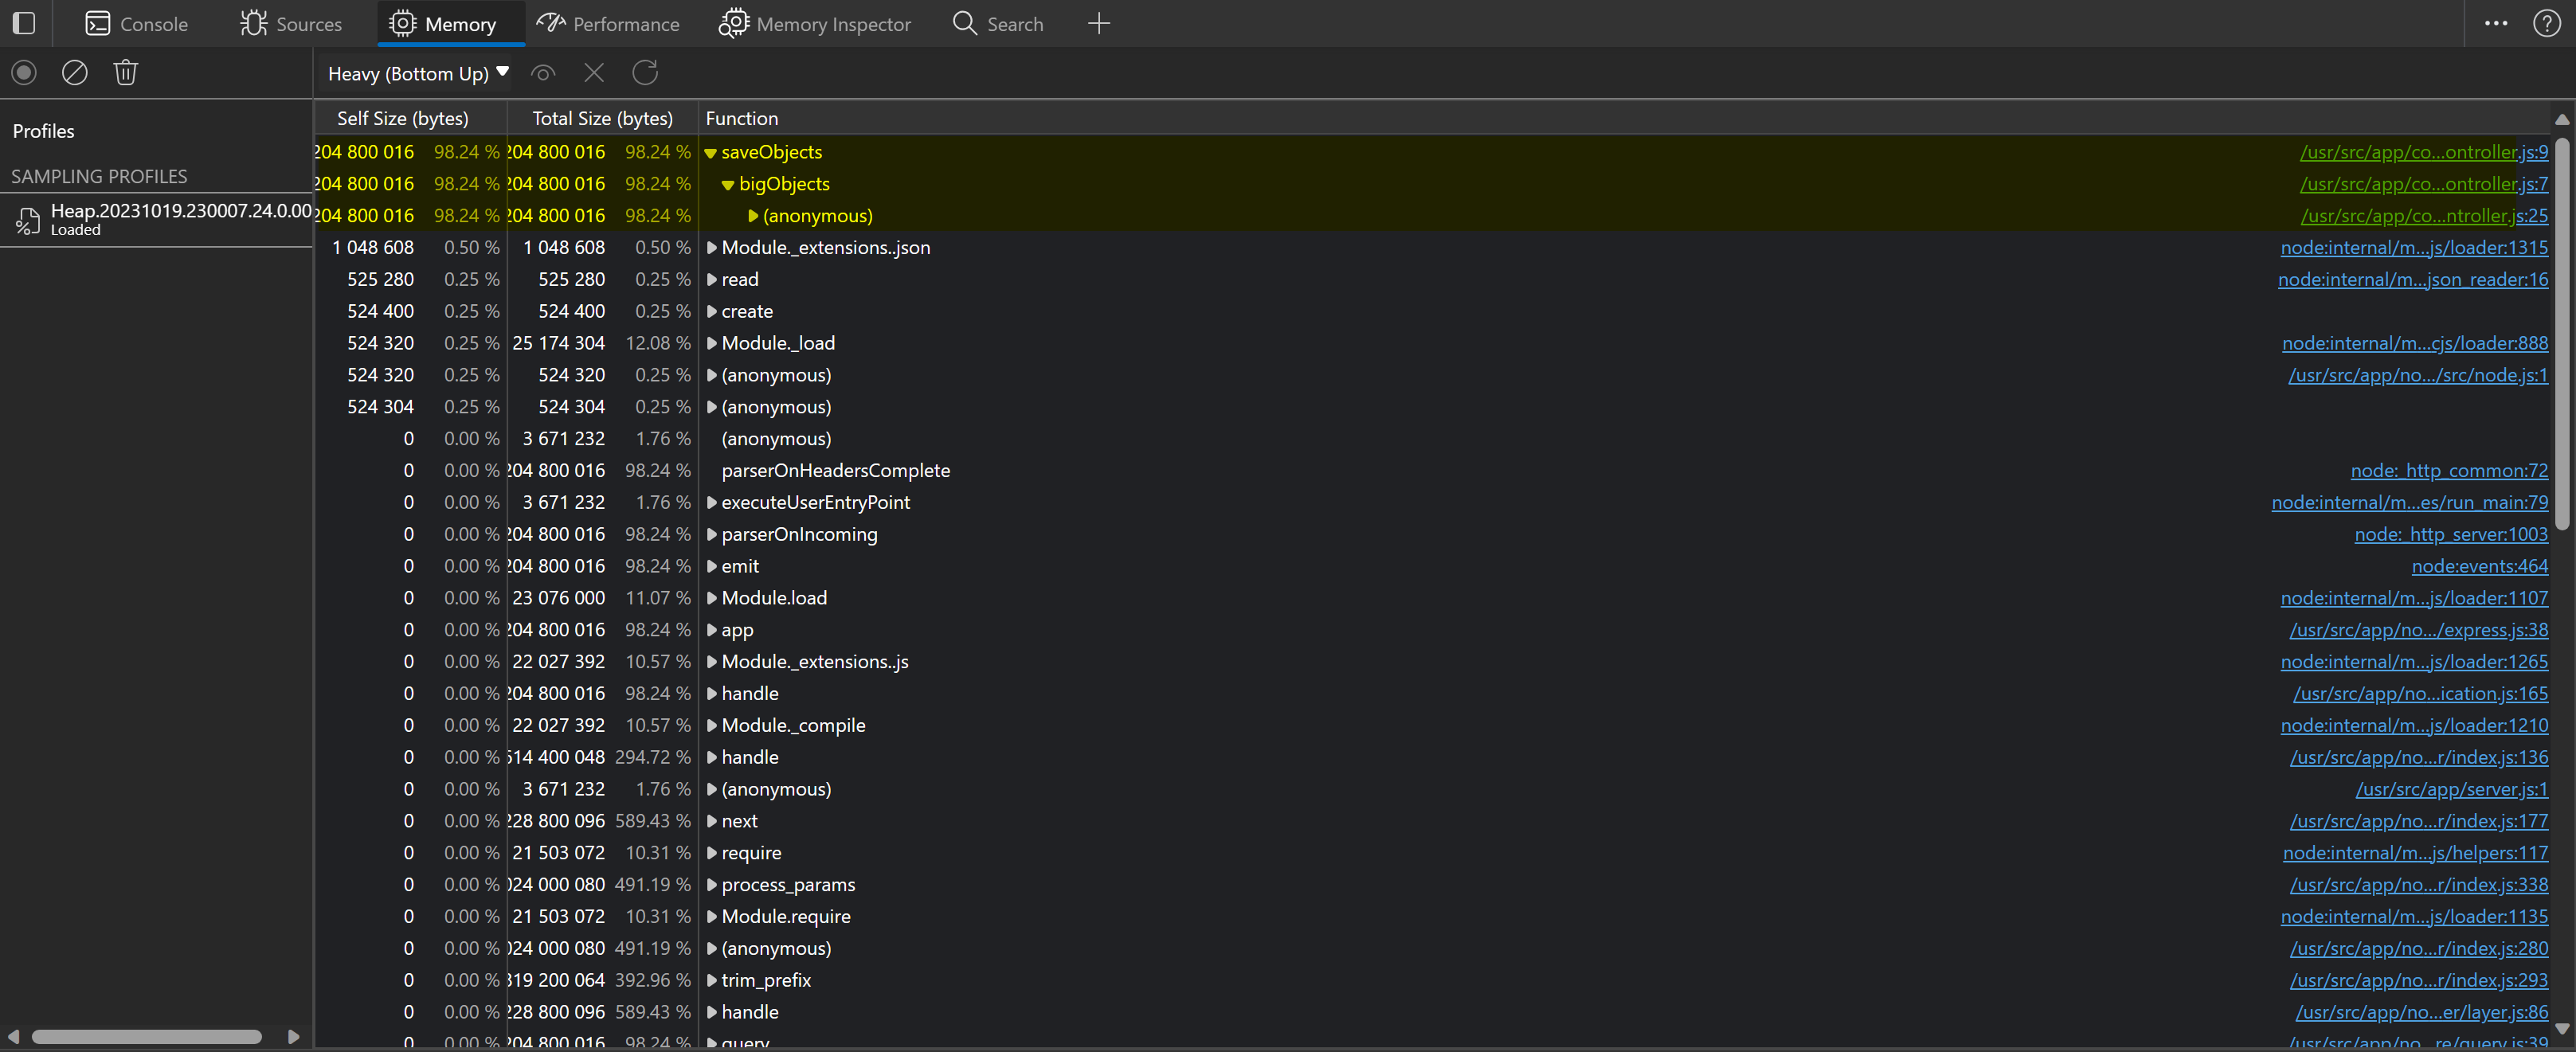
.heapprofile files are loaded the same was as in the heapsnapshot section above - although when using the “load” button in browser DevTools, you may need to change this to file types of “Sampled heap profiles.”
There is, however, a slight difference in UI presentation for these profiles - as seen in the below example.
- Self size: Allocations size in bytes for the function excluding children.
- Total size: Allocations size in bytes for the function including children.
The right right column shows the file name the function was called from.
Application Performance Monitoring tools (APM’s)
There are third-party tools that can also be used - the majority of these tools are not free, but the advantage can be huge, since these tools are specifically designed to gather extra information and present it in an understandable way for memory, cpu, and other scenarios.
Below are some popular APMs for Node:


