Container Apps: Profiling PHP applications for performance issues
This post will cover using troubleshooting tools to help profile performance issues on Container Apps with PHP applications.
Overview
Sometimes, applications may encounter issues due to poor performance - either high CPU usage, high memory (or out of memory), generally slow performance due to code execution logic, or others.
In these scenarios, if it’s been determined this is likely an application problem, you can use troubleshooting tooling to profile or take dumps of the application.
Important Prerequisites
Some important prerequisites is to be able to:
- Being able to connect to the container through the Console blade or use the
az containerapp execcommand. See console documentation here - Able to download files from the container
There is no out-of-the-box method to profile/generate a dump for an application container on Container Apps. To understand if there is application slowness, either due to high CPU, high memory, dependency problems, or other reasons - a profiler typically specific to the language/runtime you’re using should be used.
In the case of PHP - most debuggers and profilers are installed as packages and used through code or configuration. This should be validated and tested locally to ensure this works before testing on Container Apps.
Console access
You can use either the Azure CLI or the portal for console access. Below is what portal access would look like:
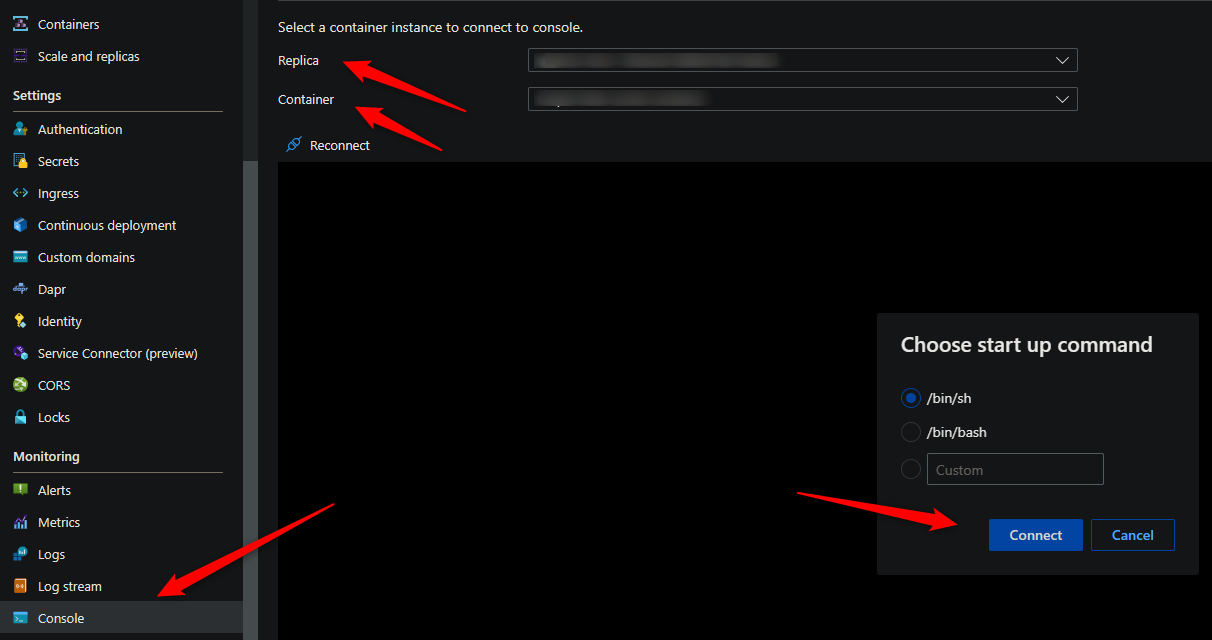
These commands for capturing profiles and dumps require access to a terminal - so console access is required.
Download files from the container
You’ll need a way to download files from the container. By default, there is no way to get files generated at runtime by a container in Container Apps without some additional configuration.
The most simplistic way is to mount a volume from an Azure File Share with an Azure Storage Account.
For a quickstart on how to add a volume, follow Use storage mounts in Azure Container Apps
NOTE: It is advised to add this mount before testing or generating files. If you do this after testing (and in single revision mode, for instance) then a new pod will be created and previous files would be lost.
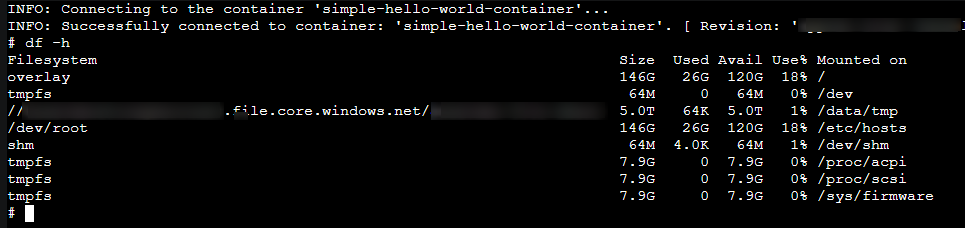
You can validate that the volume is mounted with the df -h command:
Determining high CPU or memory
Diagnose and Solve problems
You can use the following detectors in the Diagnose and Solve Problems blade to diagnose these issues:
- Container App Memory Usage
- Container App CPU usage
Metrics blade
You can use the following metric breakdowns in the Metrics blade to diagnose these issues:
- CPU usage
- Memory Working Set Bytes
- Reserved Cores
- Total Reserved Cores
cgroupv2 change
See this GitHub issue - Mitigate Potential Memory Pressure Effects With cgroup v2 - With the change for cgroupv2 from cgroupv1 can introduce unexpected memory management issues for applications.
Generating dumps or profiling
Best practices
When taking a heap dump, thread dump, or profiling - it is recommended to take a few of these while reproducing the issue for consistent data.
Taking only (1) may show data that is ultimately not relevant - taking multiple of these will show a more consistent theme in terms of what the problem may be - and would be easier to troubleshoot.
There are times when taking multiple dumps/profiles, you may notice one has a variation of data - if this happened to be the one dump/profile you took (if only taking one total), this can cause the investigation to go down the wrong path.
NOTE: When profiling an application, there is the chance this creates further negative performance impact (while profiling is occurring). This should be noted, especially for production environments.
Profilers
Xdebug
XDebug is a PHP profiler and debugger. XDebug outputs these profiles as cachegrind files, which can be read by various programs - including GUI-based programs.
Enabling this will vary depending on the Dockerfile and base image type (eg., Alpine, Debian, etc).
You can enable Xdebug by adding a few lines to your Dockerfile.
RUN pecl install xdebug && \
    docker-php-ext-enable xdebug && \
    echo "xdebug.remote_autostart=off" >> /usr/local/etc/php/conf.d/docker-php-ext-xdebug.ini &&  \
    echo "xdebug.output_dir=/path/to/volume/mount" >> /usr/local/etc/php/conf.d/docker-php-ext-xdebug.ini && \
    echo "xdebug.mode=profile" >> /usr/local/etc/php/conf.d/docker-php-ext-xdebug.ini && \
    echo "xdebug.start_with_request=trigger" >> /usr/local/etc/php/conf.d/docker-php-ext-xdebug.ini && \
This installation was tested on a Debian-based image, other distro installations may vary
In the above lines, we are:
- Using
peclto installxdebugand enabling the extension withdocker-phpext-enable - Configuring Xdebug by writing into its
.ini, such as specifying the directory to savecachegrind(profile) files, setting the mode, and for it to only profile when we trigger it
Troubleshooting
Issue:
Xdebug: [Profiler] File '/path/to/cachegrind.out.xx' could not be opened
-
Cause:
- Xdebug likely does not have proper permissions to create the
cachegrindfile under the specified directory
- Xdebug likely does not have proper permissions to create the
-
Resolution:
- Ensure the directory configured for saved files gives the container user appropriate permissions to write to the specified location
Downloading saved files
With the storage volume configured - you can download these files from your Azure File share
Generating a cachegrind file from XDebug
After enabling XDebug with any of the above methods, to generate the cachegrind file, go to your site and add ?XDEBUG_PROFILE=1 to the end of the URL. Example:
https://yoursite.funnyname-1234b.eastus.azurecontainerapps.io?XDEBUG_PROFILE=1
Reviewing XDebug profiles
WinCacheGrind (Deprecated)
As per http://ceefour.github.io/wincachegrind/, WinCacheGrind is no longer maintained.
If you want a quick guide on how to walk through opening and reviewing cachegrind files with WinCacheGrind, review the Debugging PHP Applications on Azure App Services Linux/Containers using XDEBUG - Analyzing the XDEBUG profile section which covers this.
QcacheGrind
QCacheGrind is now the recommended method of reviewing cachegrind output per the WinCacheGrind page.
If the SourceForge build has issues opening due to a missing DLL, you can try newer builds in the community, such as here.
The approach to reviewing a profile is very similar to that of WinCacheGrind. Below are some important columns to note while reviewing:
- Inclusive: The time spent in the function and any functions called
- Self: The time spent in the function and not any functions called
- Called: How many times the function was called
- Function: The function that was called
- Location: The file (or if it is internal to PHP) the function was in
The default view will look as the below, organized by the function spending most Inclusive time from the top-down:
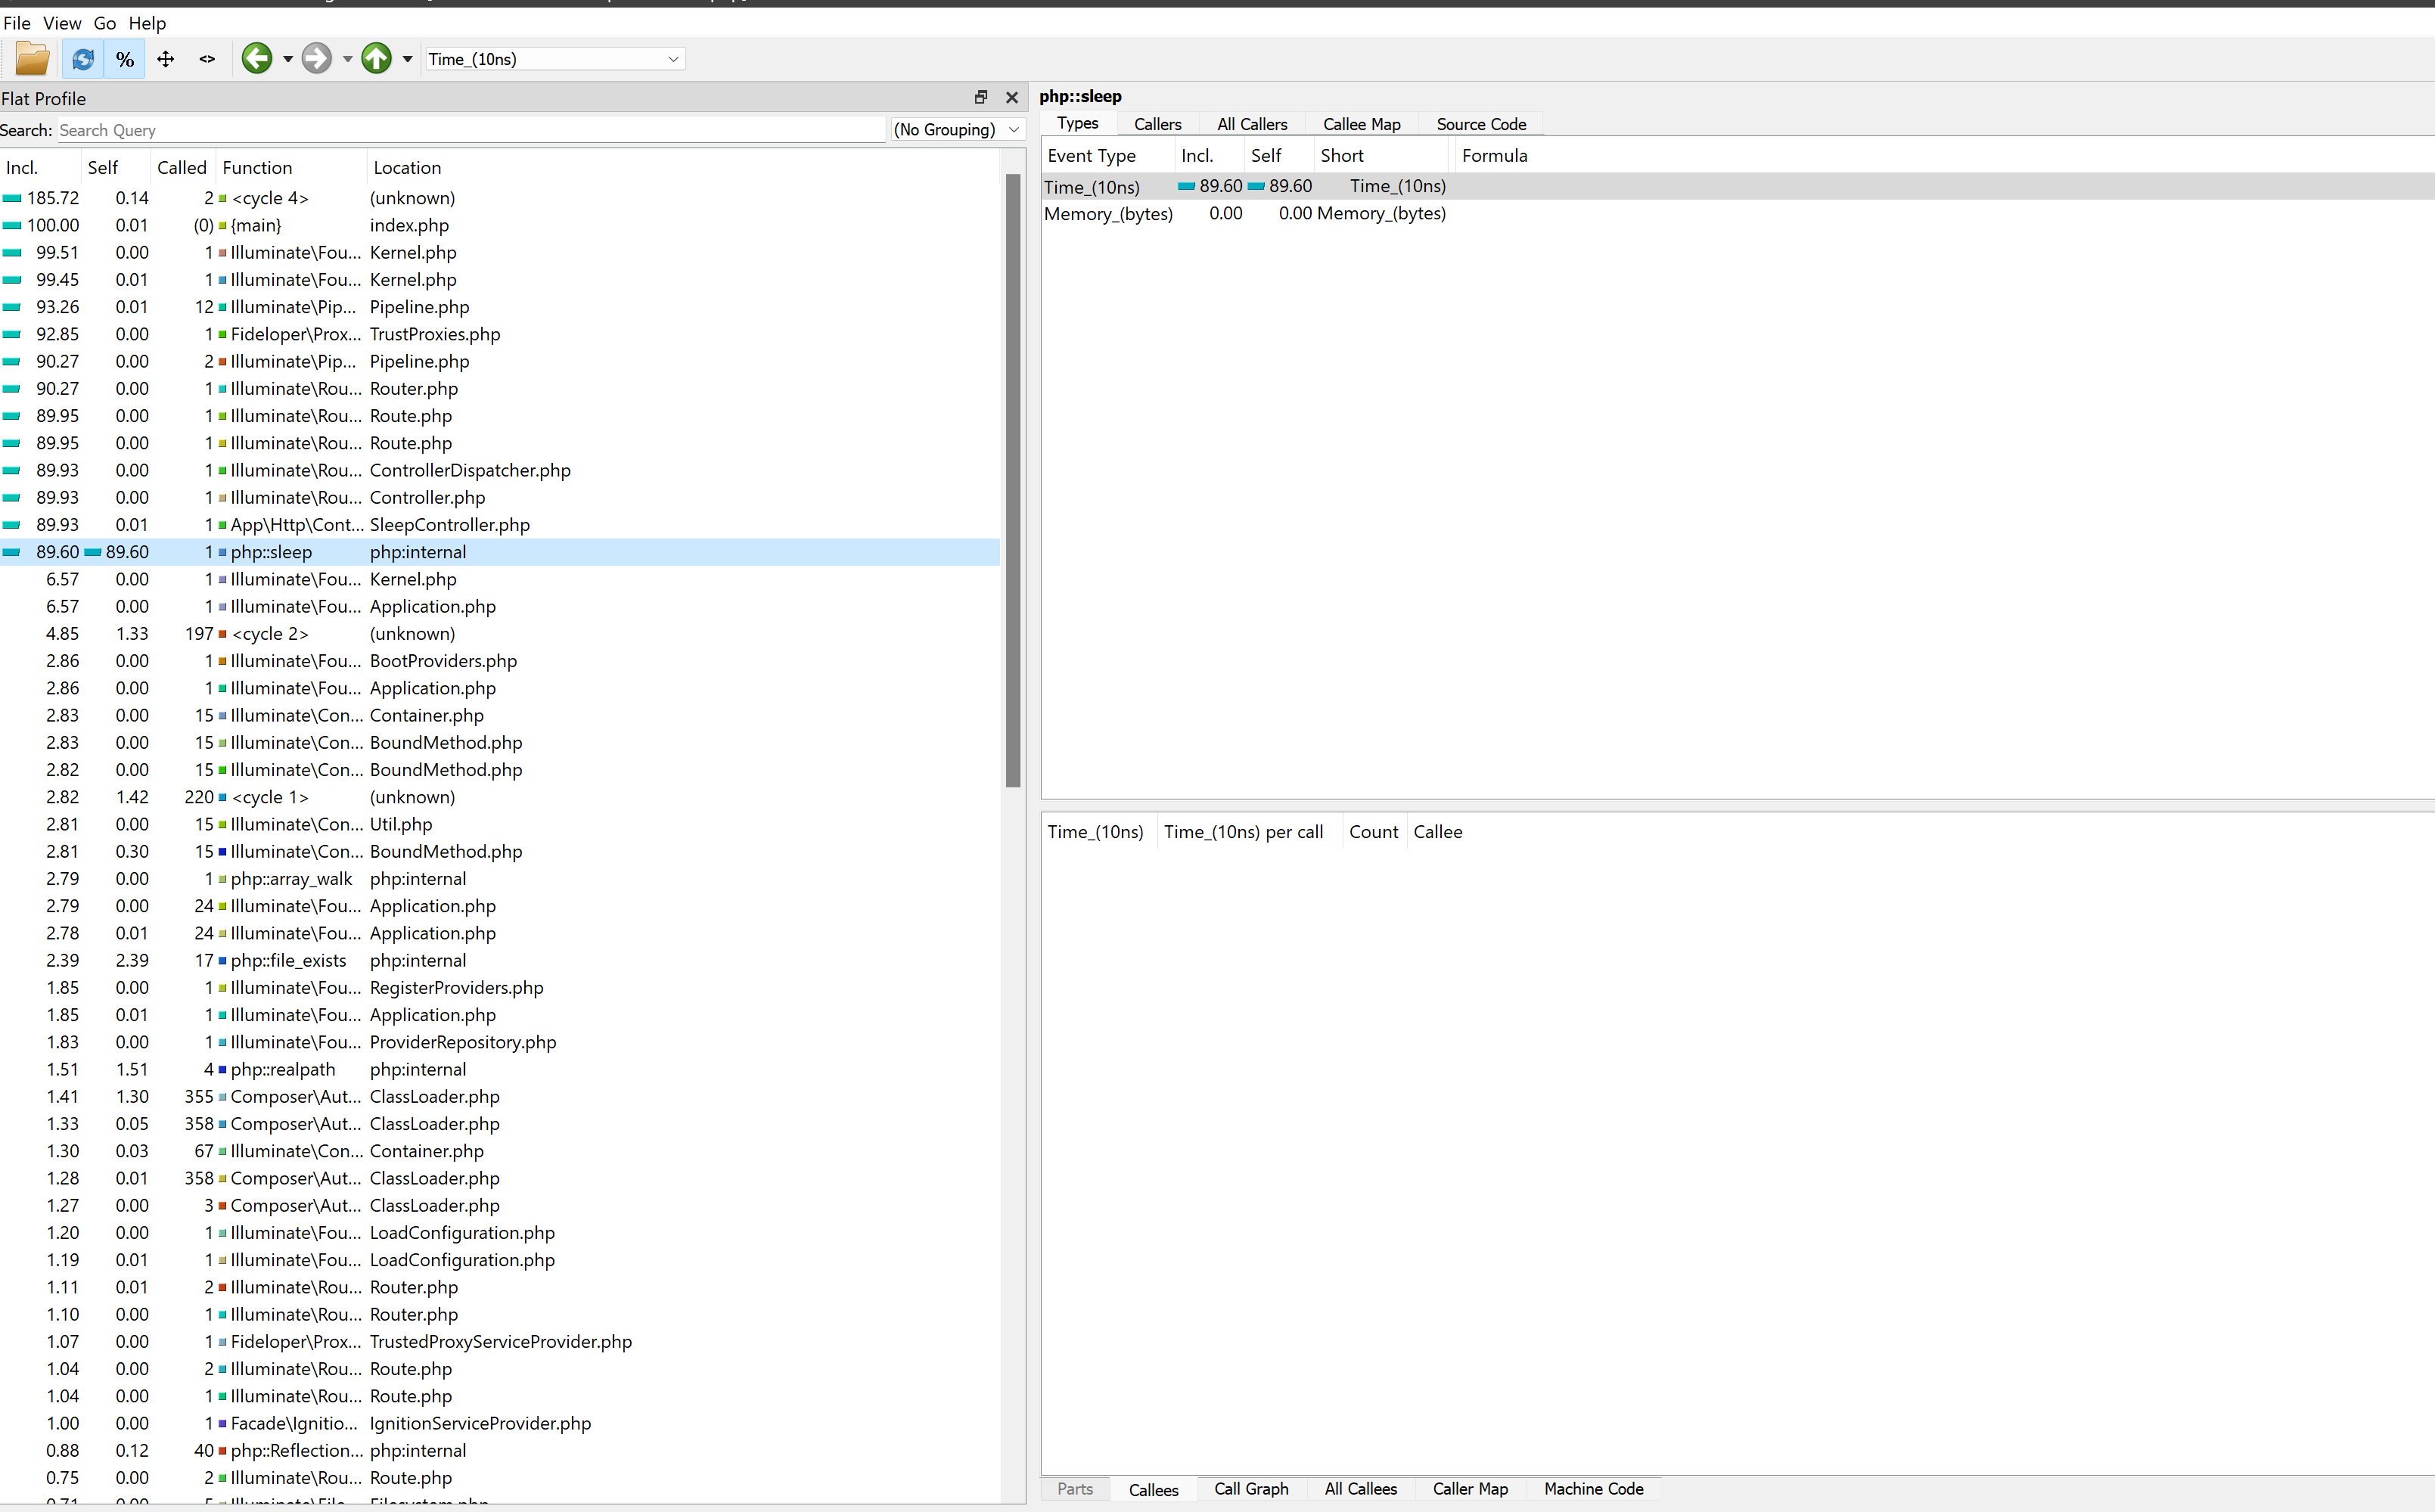
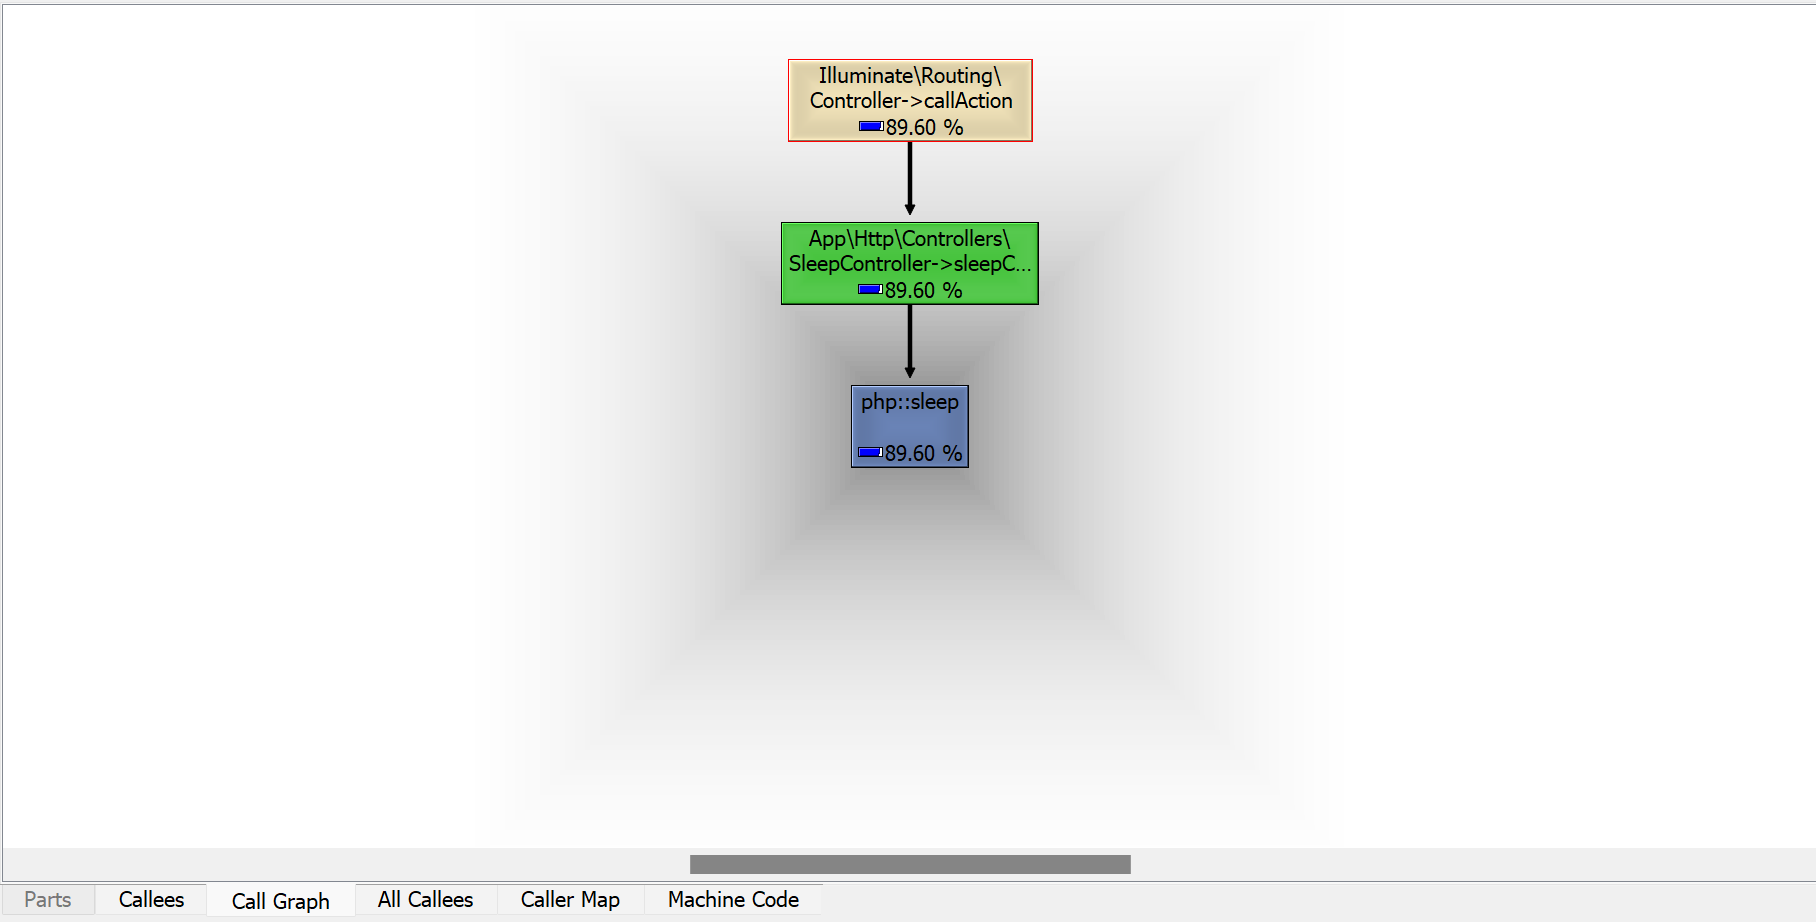
We can sort by self for functions who may have spent the most time on itself. Click the column name to sort by this. A feature of QCacheGrind is that it comes with a Call Graph for visualized call output. Take the below sleep() call that was in a controller named SleepController:
You can further review the caller of this function well as all callers that were apart of the chain of functions leading to this call through the All Callers tab:
These tabs can be explained more by the following:
The top part of the right pane contains different tabs:
- Types: Shows each measured component of the function.
- Callers: Shows direct callers of the function.
- All Callers: Shows indirect callers of the function.
- Callee Map: Shows a heatmap representation of the callee view.
- Source Code: Shows the lines of source in the file the function has.
The bottom part of the right pane contains different tabs:
- Callees: Shows the direct functions called by the function.
- Call Graph: Shows a visualization of call flow.
- All Callers: Shows all functions that get called by the function
- Caller Map: Shows a heatmap representation of the caller view.
- Machine Code: Shows a low level disassembly. Not relevant to PHP, but used if you’re looking at C/C++ programs with Valgrind.
The toolbars and menu bar contain more options:
- Detect Cycles: Try to handle recursion more optimally.
- Event Type: Visualize by time spent or memory.
- Show Percentage Relative to Parent
- Show Relative Costs: Shows relative percentage instead of exact cost.
VSCode
You can easily look through cachegrind files generated by Xdebug with Visual Studio Code. To do this, you’ll need the PHP Profiler Extension - however, having the full PHP Tools for Visual Studio Code Extension is recommended.
You can also drag-and-drop the generated cachegrind files without the need to extract these. If these are generated in a .gz format, you can drag-and-drop these directly into a VSCode window - as well as loading already extracted cachegrind files.
This will load in a hierarchy view as below:
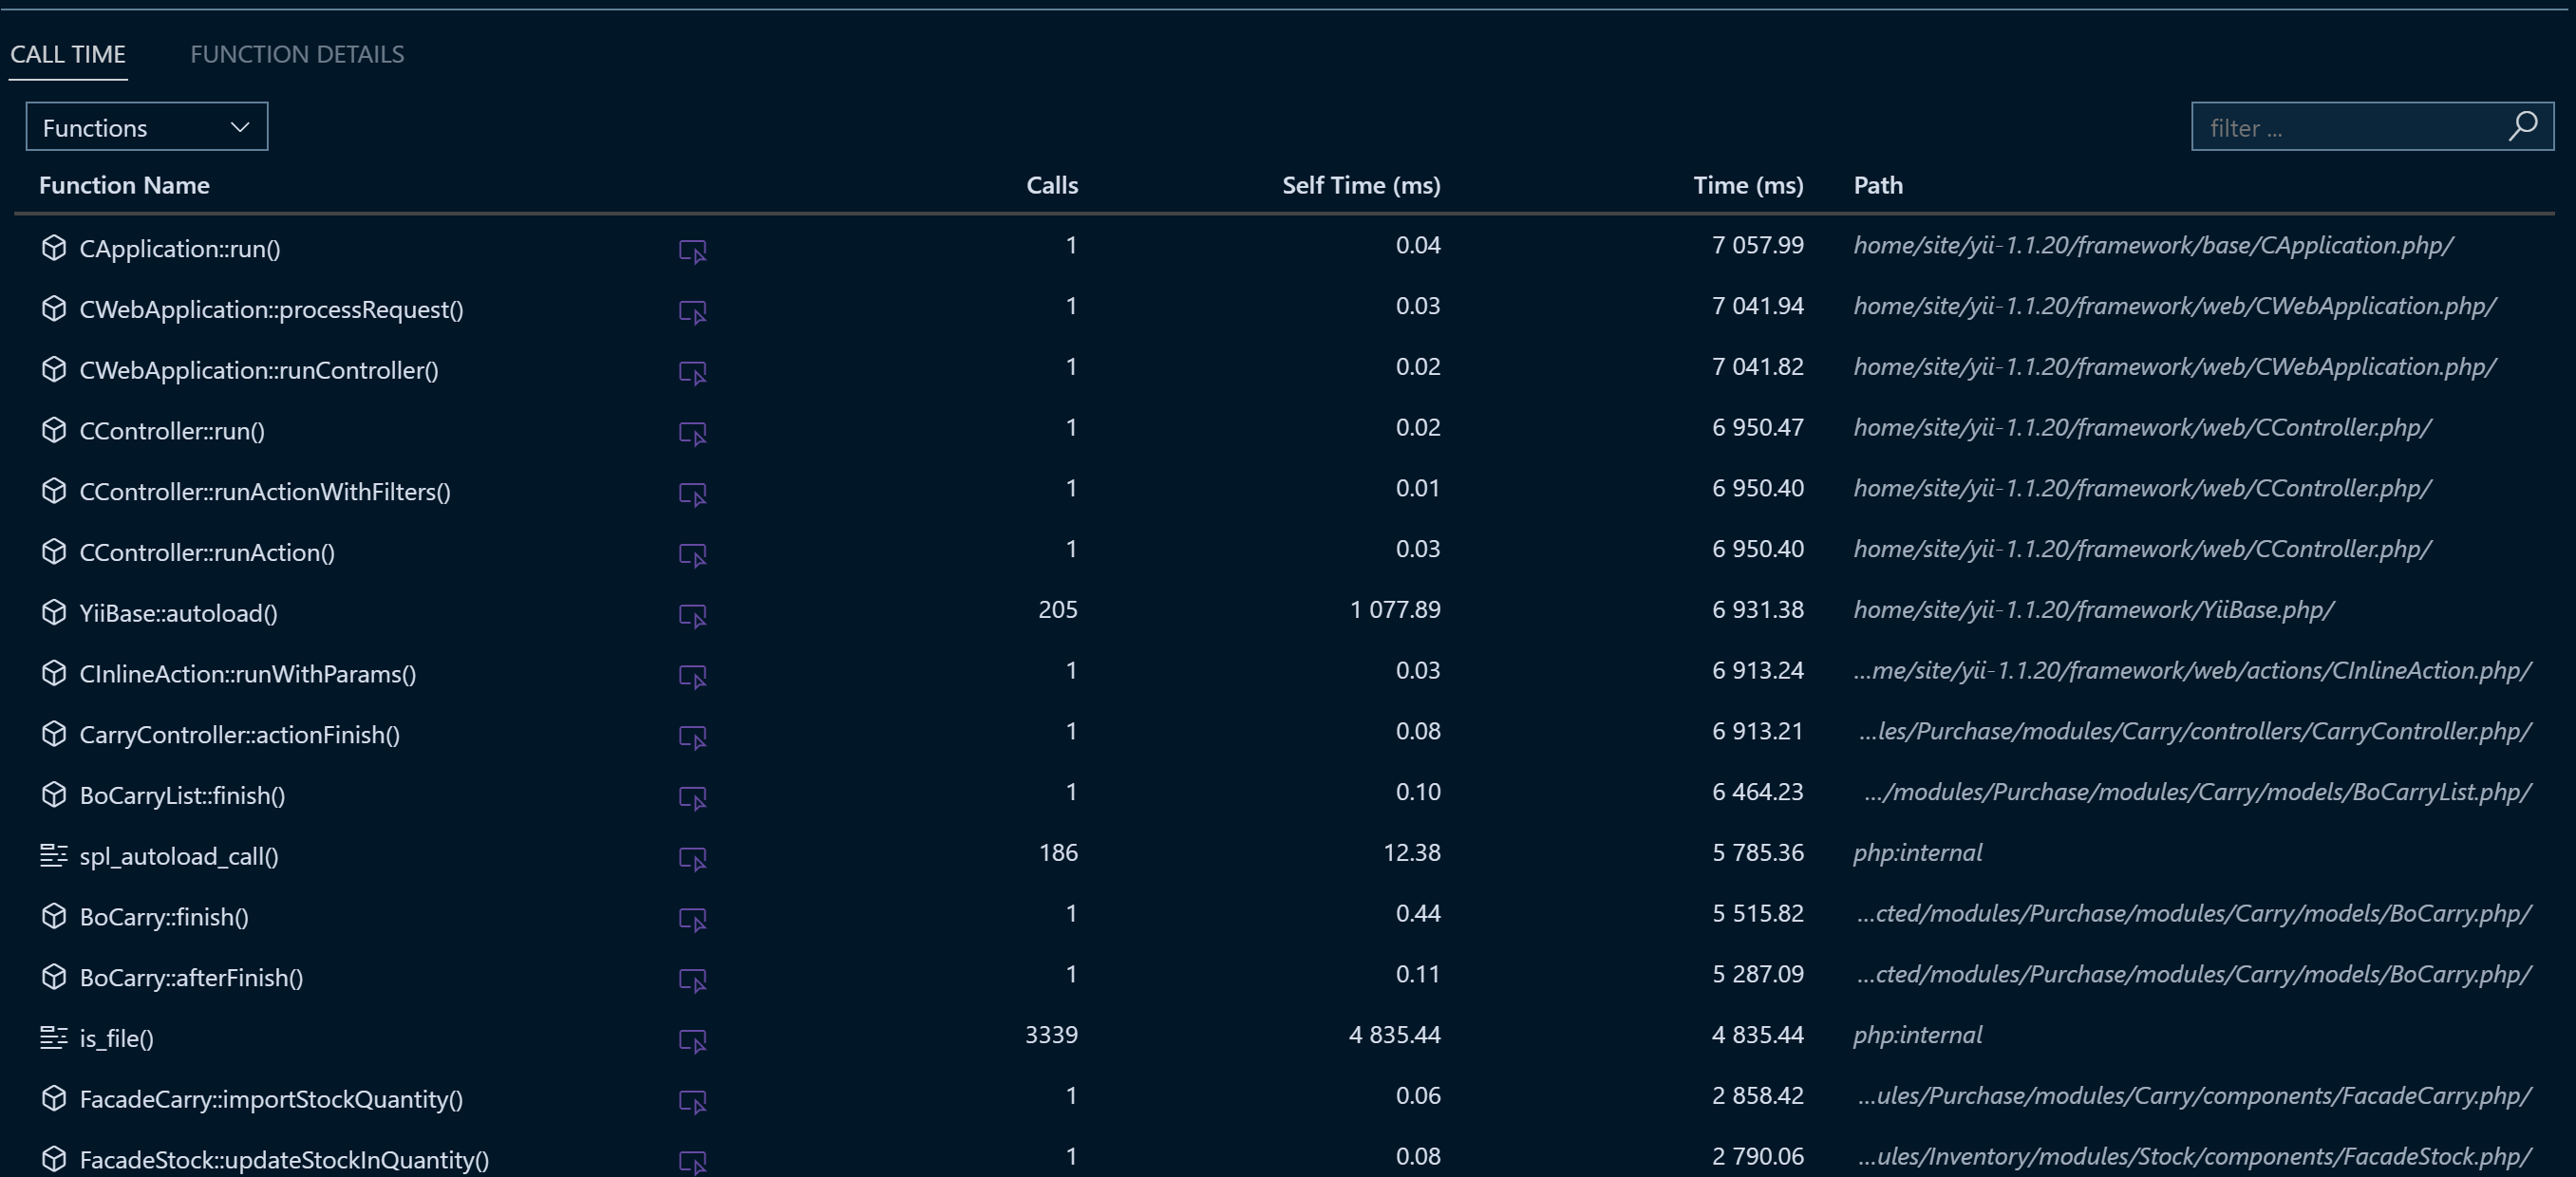
This will show the:
- Function Name: The invoked function
- Calls: How many times it was called
- Self Time (milliseconds): Time spent on itself
- Time (milliseconds): Time spent on the function plus other functions invoked from it
- Path: The code path where this was executed
If you switch to the Function Details view, this turns into a horizontal drill-down flow:
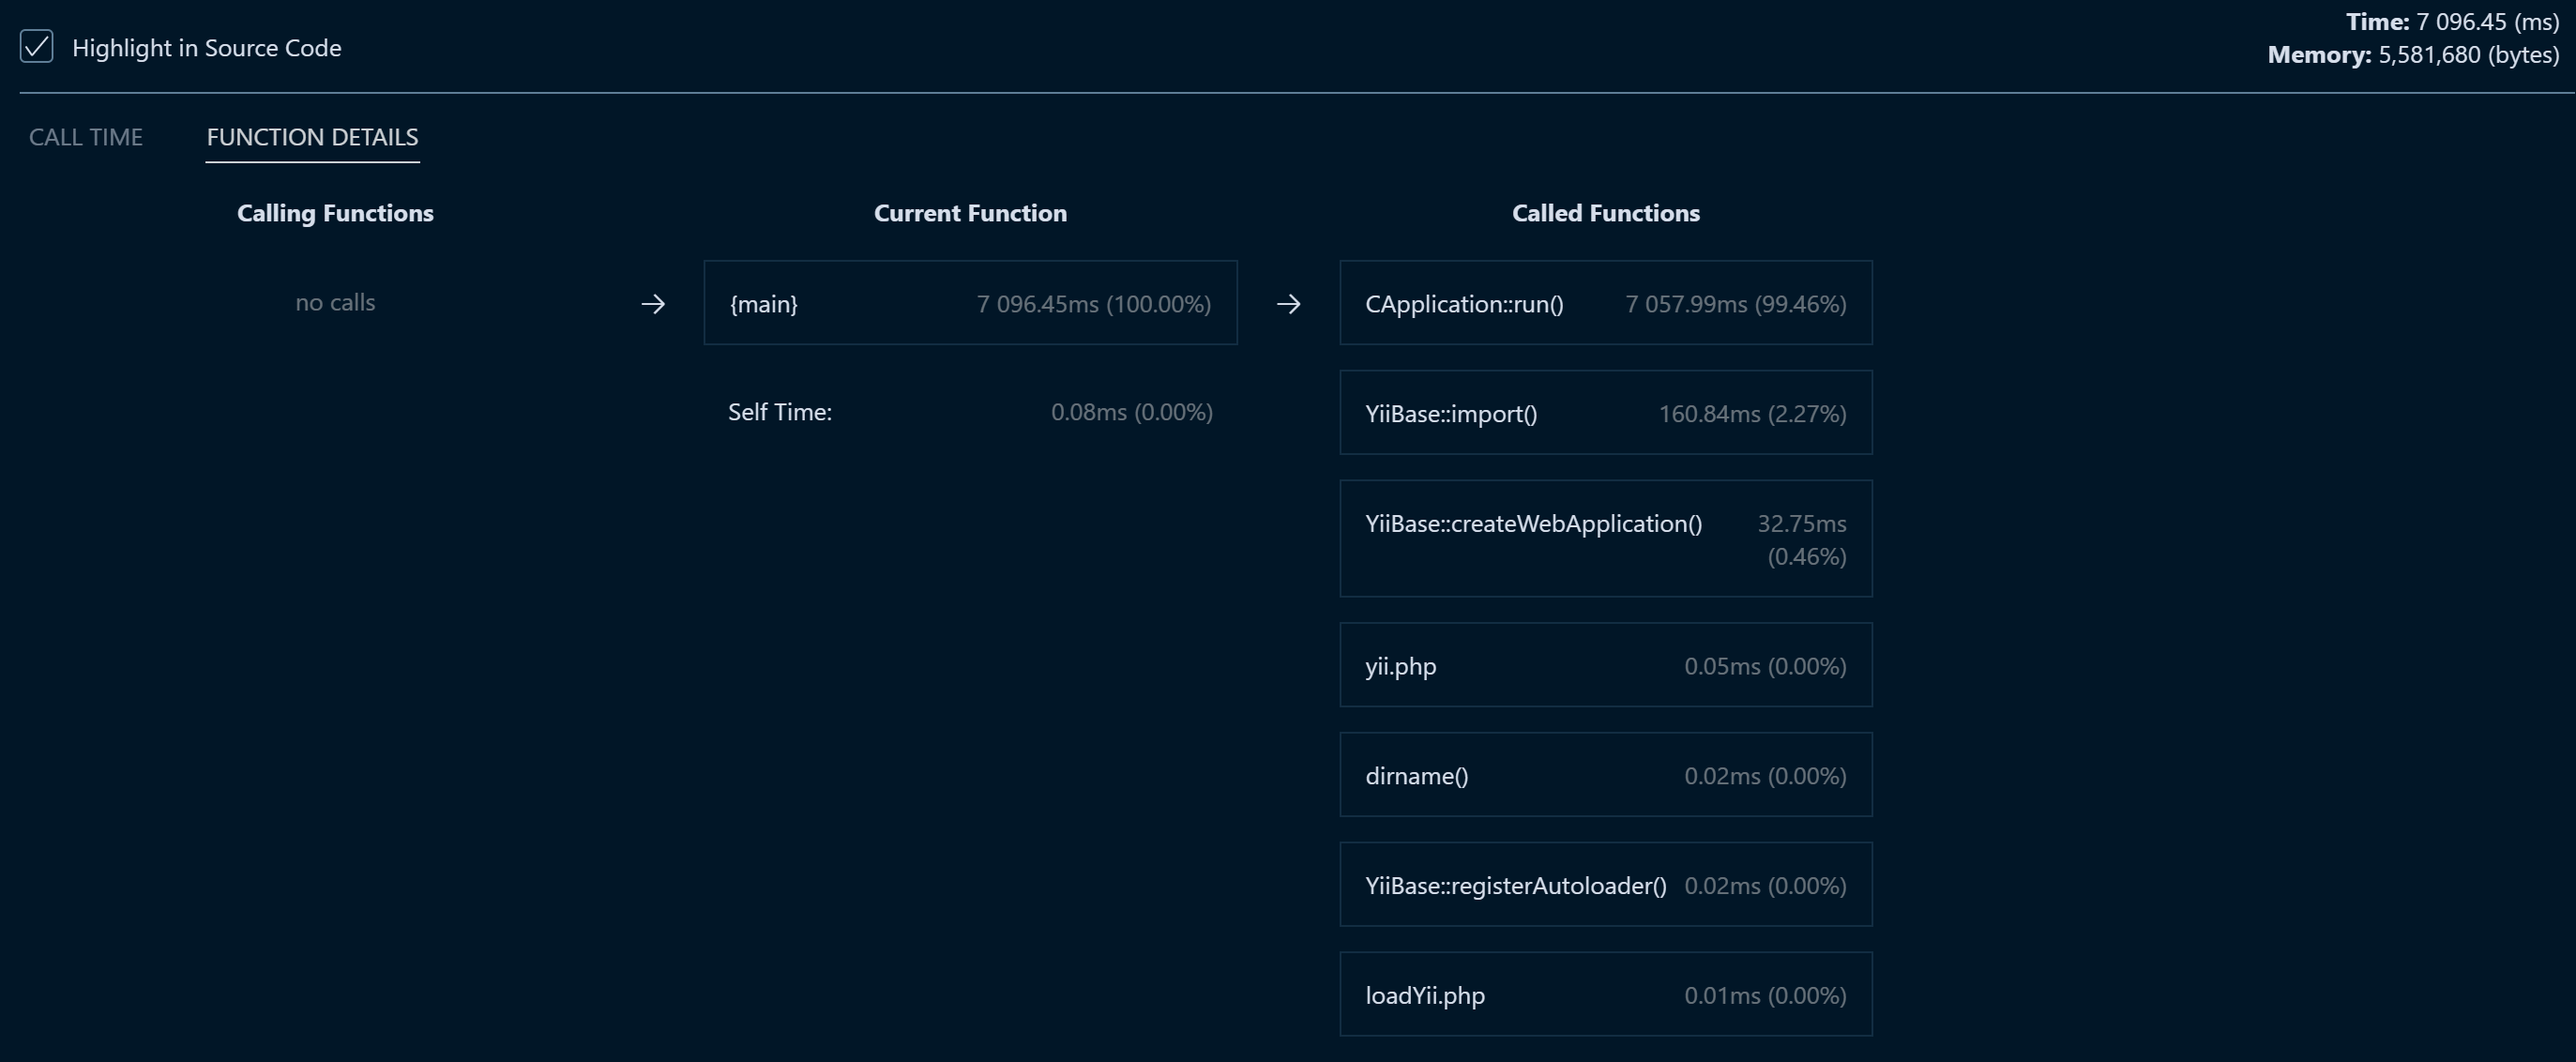
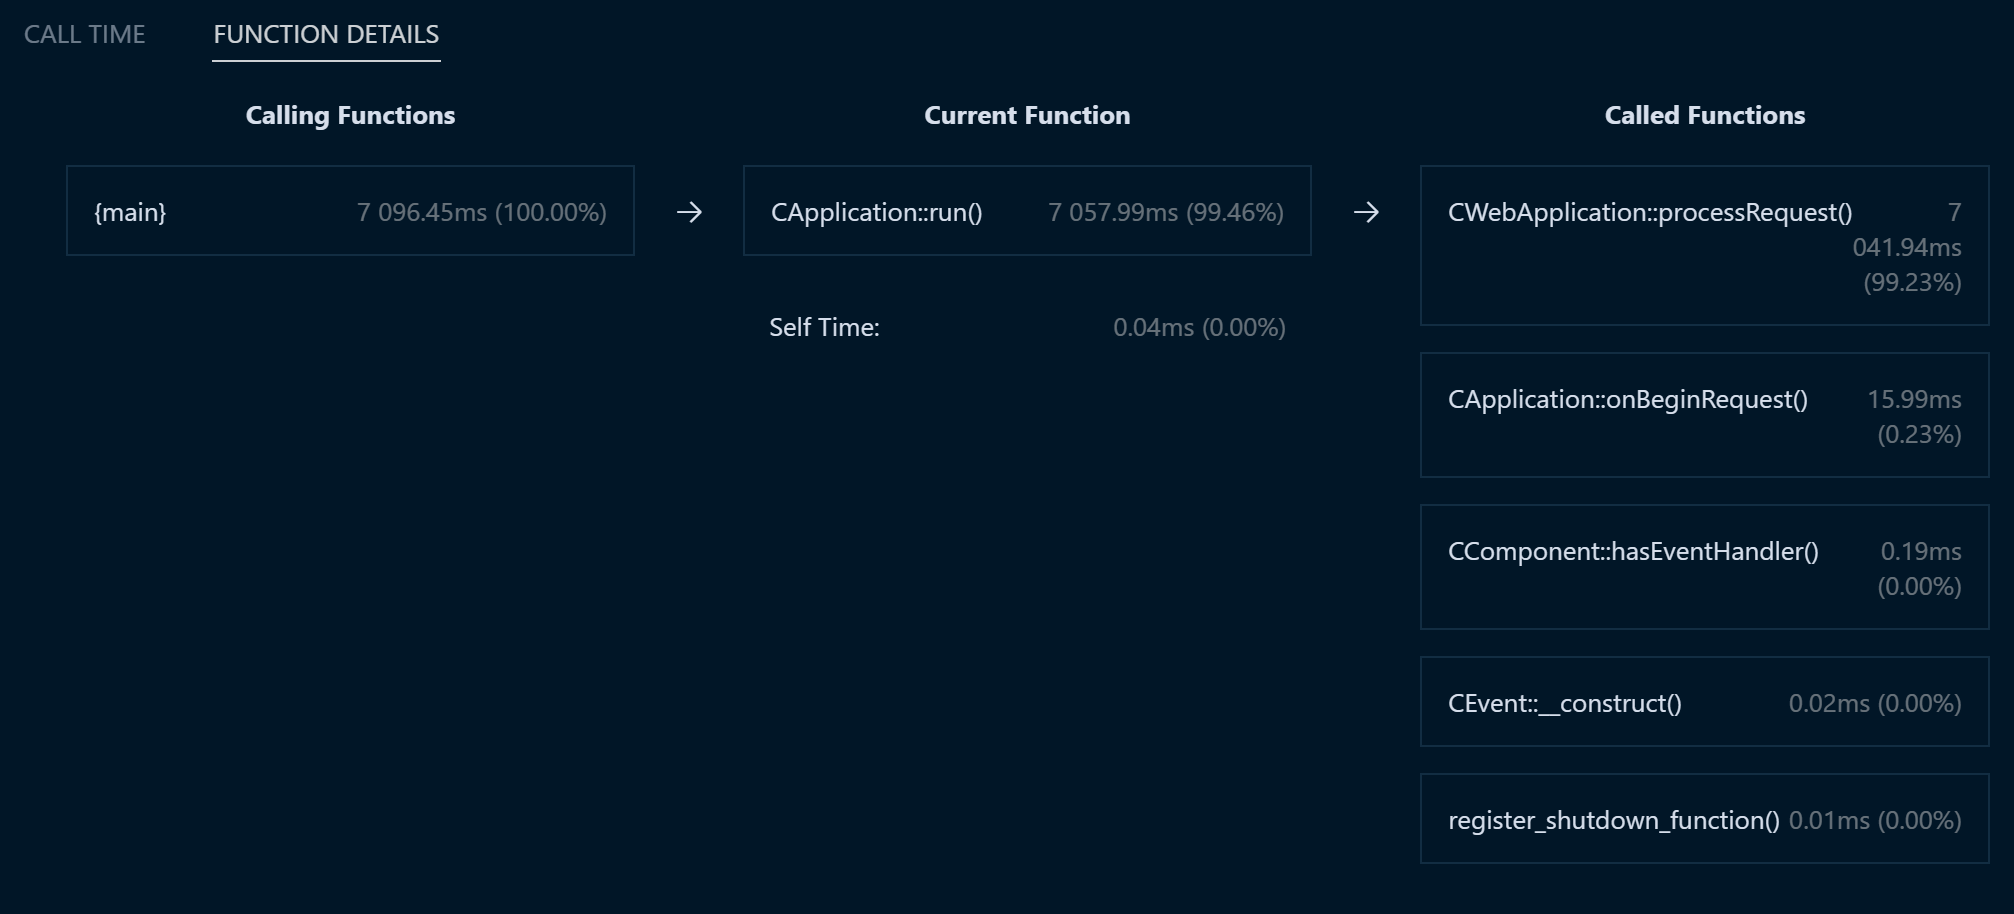
In this view, you can click on each function, which will step through the series of function invocations (if any). If a function invoked another function, and so on, you can walk through this flow - to see where total time was spent.
This is shown in the above and below screenshots with the Calling function, Current function (currently selected function), and Called functions (functions called by the current function):
Drilling down can help determine where in code time was spent, as seen below:
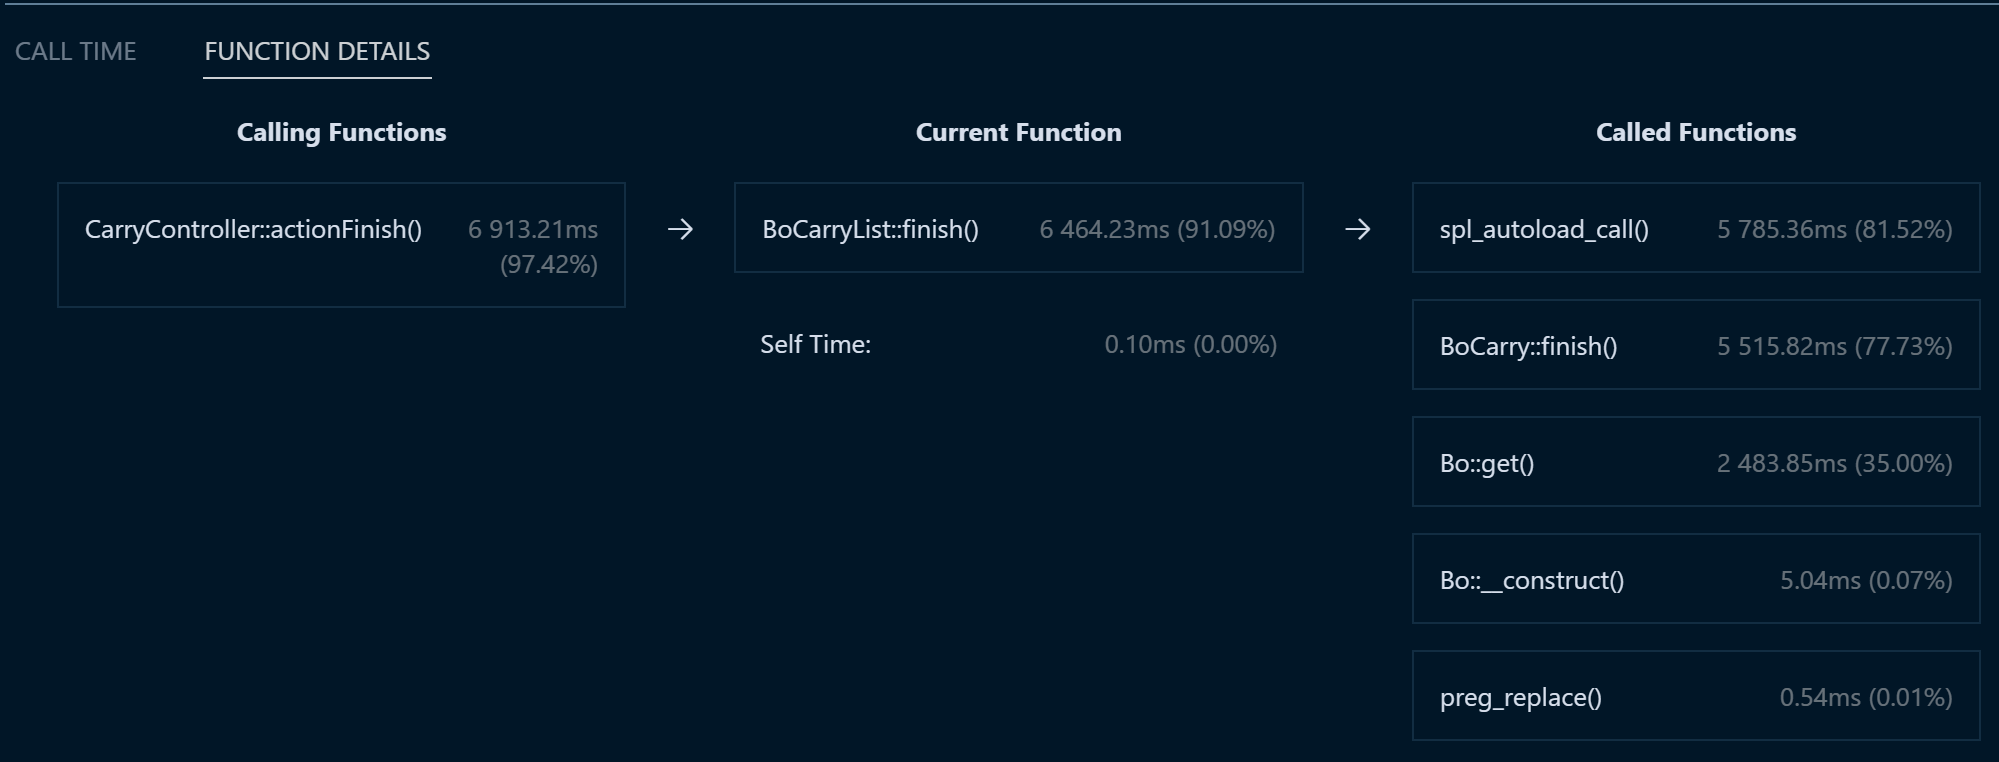
Ultimately, this is an incredibly simple way to review a profile during performance issues.
Additionally, if you run this alongside the appropriate source code - there is the option for code highlighting on the affected path. More information can be found in the PHP Profiler Extension documentation.
Debuggers
Debuggers may not capture the same information of an application in the same way typical profilers would, but it can still show useful information for less intensive troubleshooting of performance.
PHP Debug Bar
PHP Debug bar is a debug and profiling tool that can help catch slow performance and/or general errors and exceptions. When enabled, this shows up at the bottom of the browser page and as expandable bar.

By default, this comes pre-configured with the Messages, Request, Timeline and Exception tab. As well as showing additional information such as memory usage for the page being hit, request duration and PHP version.
- Messages: Any messages (like console messages) written while invoking the route.
- Request: Shows various information on the request, as well as information on these PHP variables -
$_GET, $_POST, $_COOKIE, $_SERVER. For instance,$_SERVERwill show various server side environment variables in an array. - Timeline: This will show the time taken between two points of interest within the codebase. This will can be set by start or stop functions.
- Exceptions: This will display any exceptions or errors for the page/route invoked.
Documentation for PHP Debug Bar can be found here.
Installation
PHP Debug bar depends on composer to be used to install the package.
Create a composer.json file in the root of your project folder with the following:
{
    "require": {
      "maximebf/debugbar": "1.*"
    }
}
Add the following lines to your PHP file in question:
(example index.php)
<?php
use DebugBar\StandardDebugBar;

$debugbar = new StandardDebugBar();
$debugbarRenderer = $debugbar->getJavascriptRenderer();

$debugbar["messages"]->addMessage("hello world!");
?>
<html>
  <head>
      <?php echo $debugbarRenderer->renderHead() ?>
  </head>
  <body>
      echo "Hello, from PHP Debug Bar";
      <?php echo $debugbarRenderer->render() ?>
   </body>
</html>
Adding non-default collectors
Review the documentation here for adding performance collectors that are not set by default.
NOTE: If you try to add a collector through PHP that already exists, you’ll see this:
PHP message: PHP Fatal error: Uncaught DebugBar\DebugBarException: 'time' is already a registered collector in /home/site/wwwroot/vendor/maximebf/debugbar/src/DebugBar/DebugBar.php
Timing long running operations
Since a majority of PHP applications are stateful (usually calling towards a database, other external storage dependency, or API) - this can have performance implications in certain scenarios.
If a piece of code or operation is suspected to be an issue, we can chart this operation to see the time taken between two points. Consider the following test:
// This mimics a long running operation
$debugbar['time']->startMeasure('longop', 'My long operation');
sleep(5);

$debugbar['time']->stopMeasure('longop');
// This mimics a long running operation
$debugbar['time']->measure('My long operation', function() {
    sleep(2);
});
This measures two points and then measures the operation by name (‘My long operation’). The output would be seen in the Timeline tab of the bar. This includes time spent for both operations, as well as total time.

Laravel Debug Bar
This is a package specific to Laravel - based off of PHP Debug Bar - it is a profiler and general debug tool designed to help catch slow performance and/or general errors and exceptions
How to enable
- Install the package via composer with
composer require barryvdh/laravel-debugbar --dev - Set the environment variable
APP_DEBUGtotrue
NOTE: If
APP_DEBUGis false, the bar will not show, by design.
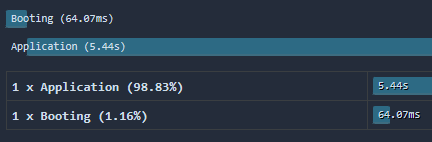
When enabled, the bar will show at the bottom of the page and look like the following:

- Timeline: The request duration and breakdown. With a breakdown on how much of this was application time:
- Messages: Any messages (like console messages) written while invoking the route.
- Exceptions: Any exceptions thrown during the handling of the request
- Views: Views rendered for the route accessed, as well as view information - such as view path in Laravel.
- Route: Various route information, such as the controller and method in the controller invoking the request, namespace, prefixes (if applicable), route ‘name’ (if applicable) and file the Controller lives in.
- Queries: If any queries were executed on the route
- Models: Models used on the route
- Session: Information on active sessions
- Request: Various request information - such as status code, status text, format, content type, request headers and server environment variables, request cookies, etc.
Current route, memory usage, request duration and PHP version are also some of the options shown.
Kint
Kint is a debugger that has a UI in the same form of what Laravel Debug Bar and PHP Debug Bar has.
Documentation for Kint can be found here.
Installation
With composer on your local environment, run the following:
composer require kint-php/kint
NOTE: If a
composer.jsonfile doesn’t exist yet, create one first and add an empty object into the file - ex.{}
This will create a vendor folder. Depending on your project, you need to do one of the following:
- If using plain PHP, require the
vendorfolder withautoload-include 'vendor/autoload.php'; - If using a framework, it most likely is already including the
vendorfolder into the project.
Next, use the following, either at an application entry point of a point of possible slowness:
d($response);
In this case, this was used in Laravel’s public/index.php file - since this is where responses are sent from. The syntax and usage for Kint is simple enough that all it requires is the d() function, which is a shorthand for Kint usage. d() requires one (1) argument, which is what is being dumped.
d() will automatically be in scope and available if imported/installed.
The following UI will be shown if succesful:
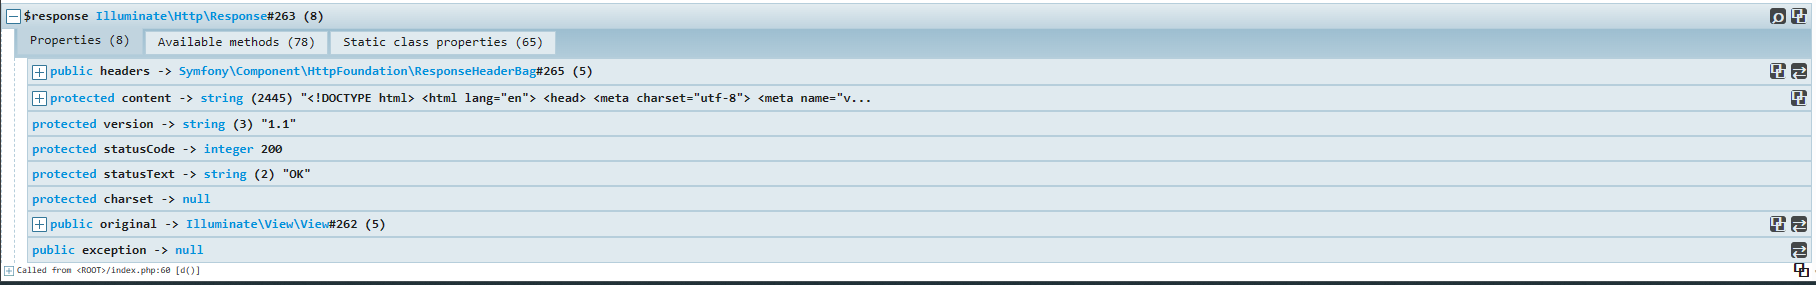
This includes the entirety of the response and more, from a deeper application standpoint - showing all functions that may have been invoked or used. Each property and available methods can be looked into. This also shows the location of where d() was invoked from.
Troubleshooting
If no UI is appearing, move the d() function to a more appropriate place in the application that can return a response. You may also need to validate what kind of argument is being passed into d().
APM tools
Below is a list of APM’s that can be used in conjunction with the tools in this post - which can be helpful in troubleshooting availability and performance issues.


