Debugging PHP Applications on Azure App Services Linux/Containers using XDEBUG
When it comes to slow performance on custom PHP applications running on Azure App Services, there will come a time where XDEBUG will need to be enabled to further assist the troubleshooting effort of an issue. Here is how we could do that.
Enable XDEBUG (App Service on Linux)
When using our blessed PHP images, XDebug can be enabled using an Application Setting via the Azure Portal.
- Go to the Azure Portal https://portal.azure.com and select your App Service Linux PHP application.
- Select Configuration option for your application.
- Under the Application Settings, click the “+ New Application Setting” option.
-
Adding the following:
Name: PHP_ZENDEXTENSIONS Value: xdebug - Save the changes.
Note: You will see that the container will be pulling from a different tag: <PHP-Version>-apache-xdebug_<release-version>
Install PHP XDEBUG Extension (Web App for Containers)
Use the following sets to install XDebug if you are using a custom container for your application.
Installing the extension
- Go to your KUDU console https://<sitename>.scm.azurewebites.net
- Select SSH.
- In your SSH session, run the command
pear config-show
root@localhost:/home/site/wwwroot#> pear config-show
Configuration (channel pear.php.net):
=====================================
Auto-discover new Channels     auto_discover    <not set>
Default Channel                default_channel  pear.php.net
HTTP Proxy Server Address      http_proxy       <not set>
PEAR server [DEPRECATED]       master_server    pear.php.net
Default Channel Mirror         preferred_mirror pear.php.net
Remote Configuration File      remote_config    <not set>
PEAR executables directory     bin_dir          /usr/local/bin
PEAR documentation directory   doc_dir          /usr/local/lib/php/doc
PHP extension directory        ext_dir          /usr/local/lib/php/extensions/no-debug-non-zts-20180731
PEAR directory                 php_dir          /usr/local/lib/php
PEAR Installer cache directory cache_dir        /tmp/pear/cache
PEAR configuration file        cfg_dir          /usr/local/lib/php/cfg
- In the output above, the path for ext_dir is where your extension will be downloaded. Note the path for later use.
- To install an extension, perform the following. I’ll be installing the PHP extension “xdebug” in this example.
root@localhost:/home/site/wwwroot#> pecl install xdebug
downloading xdebug-2.9.5.tgz ...
Starting to download xdebug-2.9.5.tgz (243,710 bytes)
..................................................done: 243,710 bytes
91 source files, building
running: phpize
Configuring for:
PHP Api Version:         20180731
Zend Module Api No:      20180731
Zend Extension Api No:   320180731
building in /tmp/pear/temp/pear-build-rootY28Lh2/xdebug-2.9.5
running: /tmp/pear/temp/xdebug/configure --with-php-config=/usr/local/bin/php-config
……
Build process completed successfully
Installing '/usr/local/lib/php/extensions/no-debug-non-zts-20180731/xdebug.so'
install ok: channel://pecl.php.net/xdebug-2.9.5
configuration option "php_ini" is not set to php.ini location
You should add "zend_extension=/usr/local/lib/php/extensions/no-debug-non-zts-20180731/xdebug.so" to php.ini
-
You’ll notice the path to the newly installed extension is also returned after it’s installed and matches the ext_dir path returned from the Pear configurations.
-
Now that the extension is installed, we’ll need to create an “ext” directory under “/home/site” and copy the extension to that directory so that the extension persists if the container is restarted. Below are the commands to do this.
root@localhost:/home/site#> mkdir /home/site/ext
root@localhost:/home/site#> cp /usr/local/lib/php/extensions/no-debug-non-zts-20180731/xdebug.so /home/site/ext
Note: The text may continue and look *garbled. Don’t worry, keep entering the command.
-
The first command creates the “ext” directory and the second command copies the PHP extension file from the installation location to the new directory.
-
Once this is done, we can move to updating our PHP settings.
Update application settings
Creating to INI file
While we are still in the SSH of our KUDU site let’s do the following.
- Go to your “/home/site” directory
root@localhost:/home/site#> cd /home/site
- Create a directory called “ini”
root@localhost:/home/site#> mkdir ini
- Change directories to “ini” directory
root@localhost:/home/site#> cd ini
- We’ll need to create an “ini” file to add our settings to. Since we are looking to activate xdebug and set some settings, I’m using “xdebug.ini” for this example.
root@localhost:/home/site/ini#> touch xdebug.ini
- Open the newly created file using VI or VIM.
root@localhost:/home/site/ini#> vim xdebug.ini
Press “i” on your keyboard to start editing and add the following:
For XDebug v2.x
# Include this line if your are using custom container
zend_extension=/home/site/ext/xdebug.so

xdebug.profiler_enable_trigger=1
xdebug.profiler_output_dir=/home/LogFiles
For XDebug v3.x
xdebug.output_dir=/home/LogFiles
xdebug.mode=profile
xdebug.start_with_request=trigger
Press “Esc”, then “:wq!” and enter to save.
Adding the Application Setting
We will now need to go to the Azure Portal and add an Application Setting to can the “ini” directory that we just created to enable XDEBUG.
- Go to the Azure Portal (https://portal.azure.com) and select your App Service Linux PHP application.
- Select Configuration for the app.
- Under the Application settings section, click the “+ New application setting”.
- For the App Setting name, enter PHP_INI_SCAN_DIR
- For the App Setting value, enter /usr/local/etc/php/conf.d:/home/site/ini
Testing and Capturing an XDEBUG profile
In the PHP settings we enabled xdebug.profile_enable_trigger=1 which would allow us to append ?XDEBUG_PROFILE=1 in the URL to trigger a profile capture.
You could do this by navigating to your site like below:
http://<sitename>.azurewebsites.net/myphppage.php?XDEBUG_PROFILE=1
This will generate an XDEBUG profile in your /home/LogFiles folder. You should have files named like so: cachegrind.out.##
Analyzing the XDEBUG profile
In order to analyze your XDEBUG profile you will need to first install WinCacheGrind which will allow you to view these cachegrind.out files.
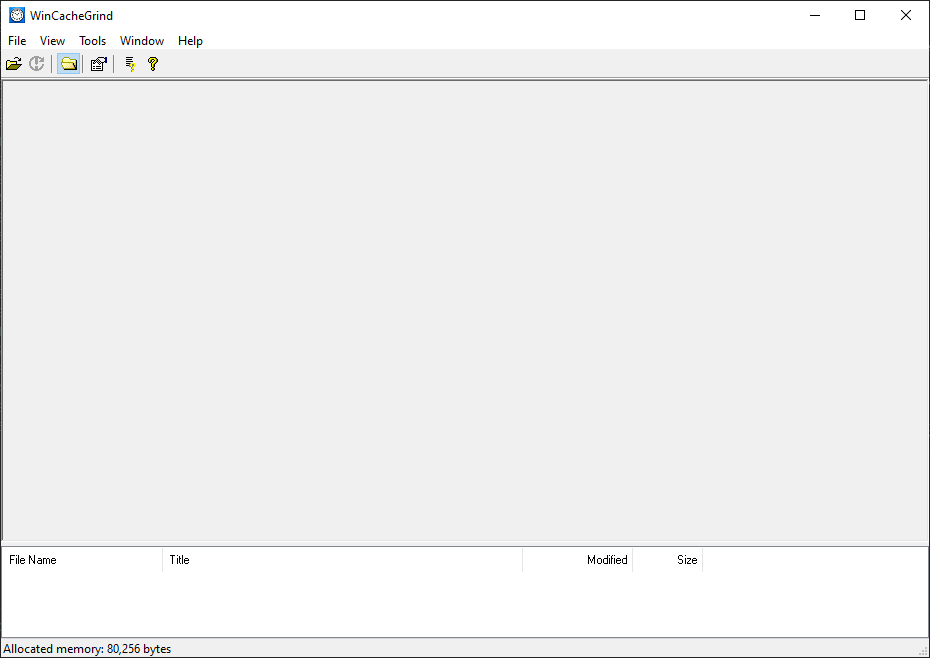
Once you have downloaded WinCacheGrind, open the WinCacheGrind.exe. You should have a window similar to below:
Go to File > Open and open the cachegrind.out file for the XDEBUG profile you would like to look into.
Once you have opened your cachegrind.out file you will see a trace semi similar to this. Please keep in mind all PHP applications are different and will look different. This example is of a Laravel application so you will see lots of calls to the Illuminate library namespace.

Here we can see that the commulative time is 1,536ms and the {main} function has a time of 1,536ms. Double click the parent call until we get to something within the application or something of concern.
With Laravel we want to get to the point where we have a call similar to runController.
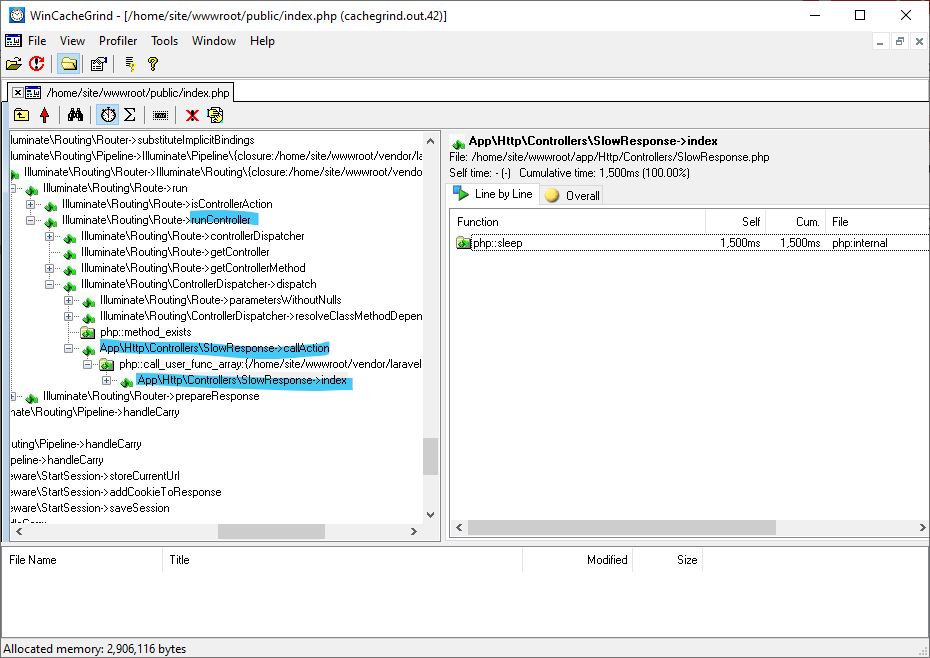
In this image we can see that we have gotten to our controller called App\Http\Controllers\SlowResponse and we are looking at the function index. Now for this example I made it easy to spot what the issue was and why it this call took a while. On the right, we can that php::sleep function was called and spent 1,500ms on itself. This is obviously something that would cause a response delay.
This next example we are going to take a look at something a little differently.
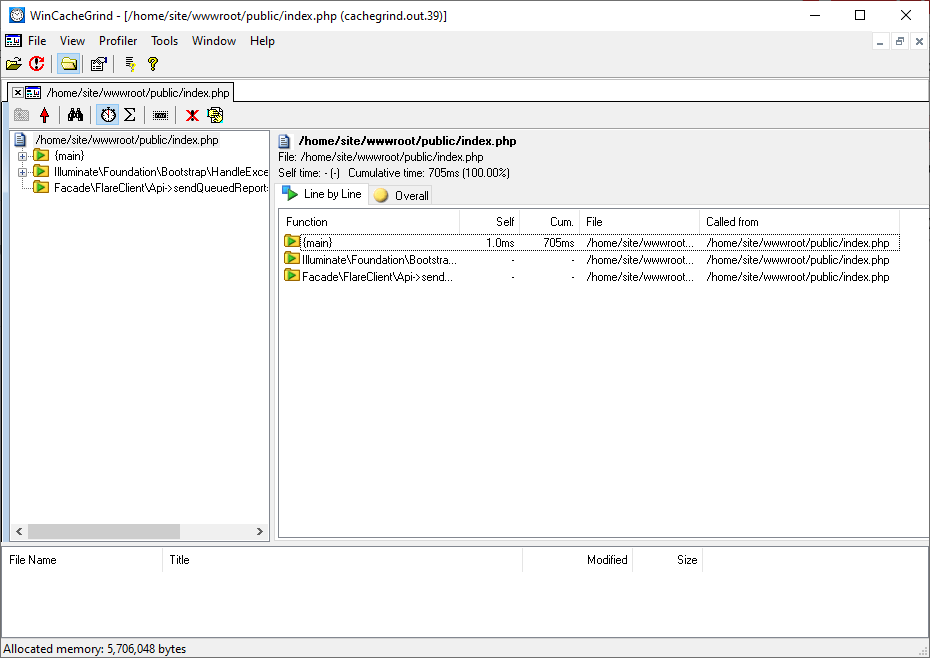
In this example the cumulative time is around 705ms. Doesn’t seem like a lot but could be for some customers.
When we drill down to our application code we could see the following happening.
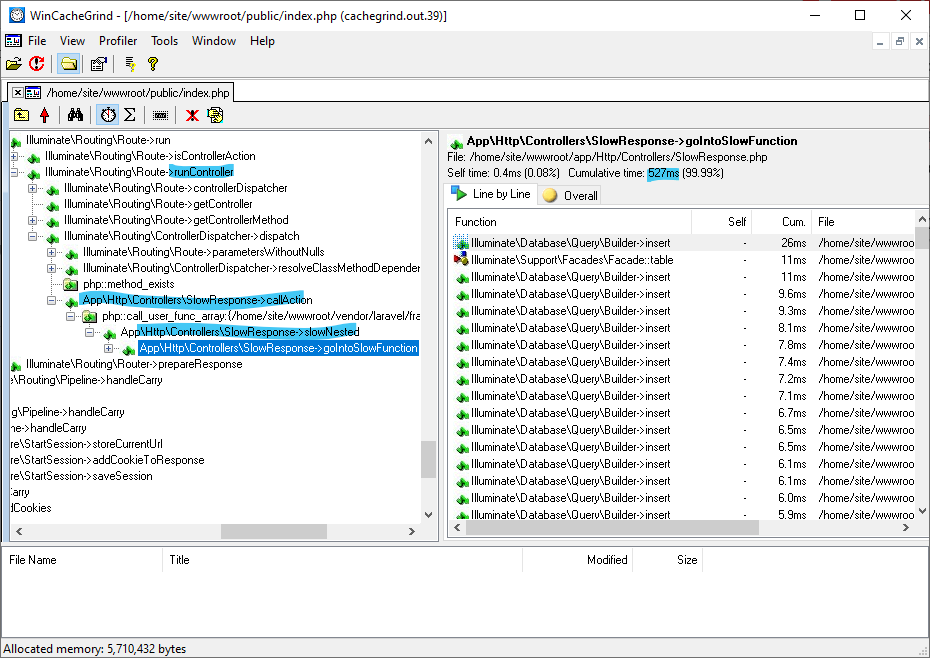
Coming down to the controller itself, we could see that the function took about 527ms of the 705ms for the total request. Here we see that we are still calling into the controller App\Http\Controllers\SlowResponse, however we are now calling a different function called slowNested. In this function we can further go down into the goIntoSlowFunction function. Look at all those database insert calls. The majority of the time being used up here is on database executions. In this example, optimizing the database calls might help with performance in the application.
Conclusion
Although all applications are different, viewing the XDEBUG profiles are typically the same. When it comes to slow requests, we want to see where most of the time in the request is being taken place. This will better help us understand what to look for and how to go about looking at these traces.


