Collecting a Network Trace on Linux Web Apps
This post will cover the setup, installation and use of tcpdump to capture network traces for troubleshooting connectivity related issue.
Overview
Capturing a network trace involves recording and analyzing the traffic flowing through a computer network. There are several compelling reasons to perform this task, primarily revolving around troubleshooting, security analysis, and network optimization.
Firstly, network traces are invaluable when troubleshooting network-related issues. By capturing packets, we can pinpoint the source of problems such as slow connections, packet loss, or service disruptions. Analyzing these traces helps identify anomalies in communication patterns, revealing potential misconfigurations or faulty devices within the network.
The advantages of capturing network traces are plentiful. It provides a granular view of network activities, allowing for detailed analysis and diagnostics. This visibility aids in troubleshooting problems swiftly and effectively, reducing downtime and enhancing overall network reliability. Some intermittent networking issues can be harder to troubleshoot as it might be tricky to capture the trace while the issue is happening though.
Requirements
To capture a Network Trace on a Linux Web App, you need the following requirements:
- Access to Kudu/SCM site. The documentation for the Kudu service is available here.
- SSH access into your container. If you are using one of our blessed images, this is enabled by the default. If you are running a custom container, you can setup the SSH access by following our guide here.
- Your Web App needs to access external endpoints (to install
tcpdump), please make sure the outbound connections are not being blocked.
Setting up tcpdump:
The first step is to instal and setup tcpdump through Kudu SSH.
Depending on the application stack you are using on Azure App Service, the underlying Linux Distribution might be different (Alpine, Debian, etc). If you have a Web App for Containers running a custom container, the Linux Distribution will also be different.
Because of this, the commands needed to run to install tcpdump might change.
Note: The App Service blessed images might already ship
tcpdump. You can test this by runningtcpdump --von the Kudu SSH.
- The first step is to make sure we have the package dependencies updated:
apt updateon Debian-based distrosapk updateon Alpine Linux distros
- Then we can install
tcpdumpby running:apt install tcpdumpapk install tcpdump
To confirm that the installation of tcpdump was successful you can run tcpdump --v which should output the installed tcpdump version.
Collecting the Network Trace
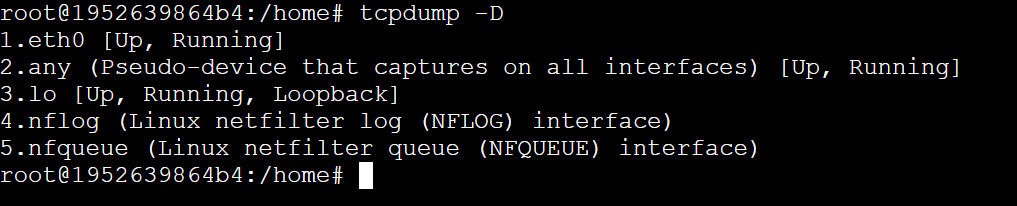
Before collecting the Network Trace we need to identify which Network Interface we want to collect the trace from. To check the available interfaces, run tcpdump -D.
If there is a VNET connected, it will look like this:
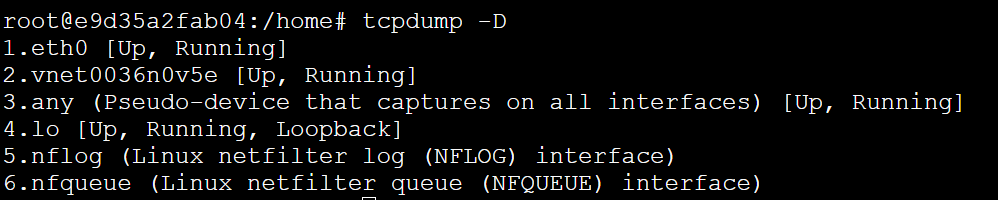
After you’ve selected the desired VNET, you can collect the Network Trace by running the following command tcpdump -i eth0 -s0 -w trace.pcap.
To stop the capture, press CTRL+C. Each option on this command has the following explanation:
-i: This defines which interface will be used to capture the traffic. If you want to use all interfaces use-i any.-s: This sets the SNAP length, which is the size of the packet to capture.s0will set the size to unlimited.-w: Writes the capture to a file and defines the name of that file.
What if I need to run the capture for a long time?
There are cases where the issue is intermittent and you might need to run the Network Trace for a long period of time.
One useful tool to make sure we can run the tcpdump on the background is screen.
screen is a versatile tool enabling users to manage multiple terminal sessions within a single window.
Initiating a session is as simple as typing screen, granting a new shell session. It allows seamless detachment from a session without closure via Ctrl + A and d, enabling reattachment later with screen -r.
To rotate the files on tcpdump, which might be useful for scoping down the issue when we have a timeframe, the following tcpdump command can be used: tcpdump -i any -w ./trace -W 5 -C 2.
The explanation is simple:
-Wdefines the amount of files to be kept on the rotation (trace1,trace2,trace3, etc).-Cdefines the size of each file in million of bytes (1,000,000 bytes, not 1,048,576 bytes).
With this, you can leverage the screen features to leave the tcpdump running in the background, collecting useful data for a future troubleshooting.
# Analyzing the Network Trace #
There are several different ways to analyze the Network Trace. You can do this on the command-line by running tcpdump -r dump.pcap.
You might find that this is not the easiest way, so alternatively, you can download the .pcap file to your machine locally and use tools such as Wireshark. You can download the .pcap file from Kudu by going to the File Manager available on the new Kudu UI. You can browse to it on https://<app name>.scm.azurewebsites.net/newui/fileManager.
![]()
Just click on the download icon in front of the file you want to download.


