Using Zipkin and OpenTelemetry on Azure Container Apps
This post will go over how to set up a basic opentelemetry implementation that exports traces to Zipkin as a backend, all hosted with a Container App Environment
Overview
Note, this is not using the “managed” opentelemetry collector that Container Apps has as a in-preview feature, which is described here: Collect and read OpenTelemetry data in Azure Container Apps (preview)
This post will cover setting up a “custom” implementation, which wil have three (3) general parts:
- Client: The client/application. For the sake of blog, this won’t go much into the client and setting up SDK or codeless instrumentation for the application. This can be any application using the opentelemetry SDK or codeless agent
- Collector: The opentelemetry collector
- Backend: Zipkin
Setting up
If not done so already, create a Container App Environment and deploy your opentelemetry instrumented application
Instrumenting an application with opentelemetry can be found in Zero code instrumentation or opentelemetry - Language APIs & SDKs
NOTE: The below FQDN’s used for Zipkin is the Kubernetes-based pod name. The FQDN used for the opentelemetry collector is an internal FQDN. It is possible to use an external FQDN for both of these.
Zipkin
We can use the Docker Hub image for Zipkin to quickly set up a basic Zipkin applicatiion. Zipkin defaults to using in-memory storage, therefor any container or pod/replica restarts/recreations will cause this data to be deleted.
In a production scenario, you want to set up a storage backend of either Cassandra or ElasticSearch. Configuration on how to do this can be found here: openzipkin - storage
For this proof-of-concept, we’ll be using in-memory storage.
-
Create a Container App using the Zipkin Docker Hub image
openzipkin/zipkin:latest- make sure to remember the name of the Container App - this is important for later. We’ll just name this “zipkin”: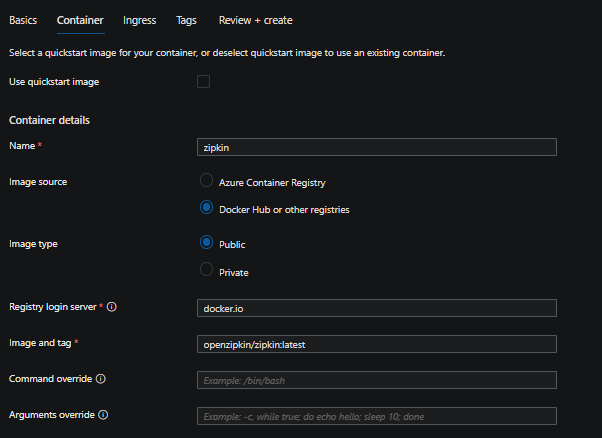
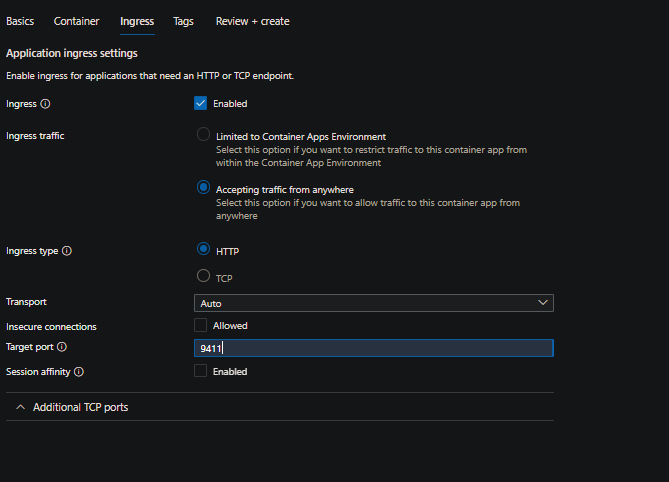
- Set the following:
- Ingress traffic: Accepting traffic from anywhere
- Ingress port: 9411.
For the purpose of this, we’ll be setting the above ingress traffic setting so we can view data in the browser. In production scenarios, we would want to lock down traffic to a known set of IP’s.
-
Create the Container App. Since we’ll be using in-memory storage we want to set our minimim replica count to one (1). After creation, navigate to the Scale blade and change the Min replicas count:

-
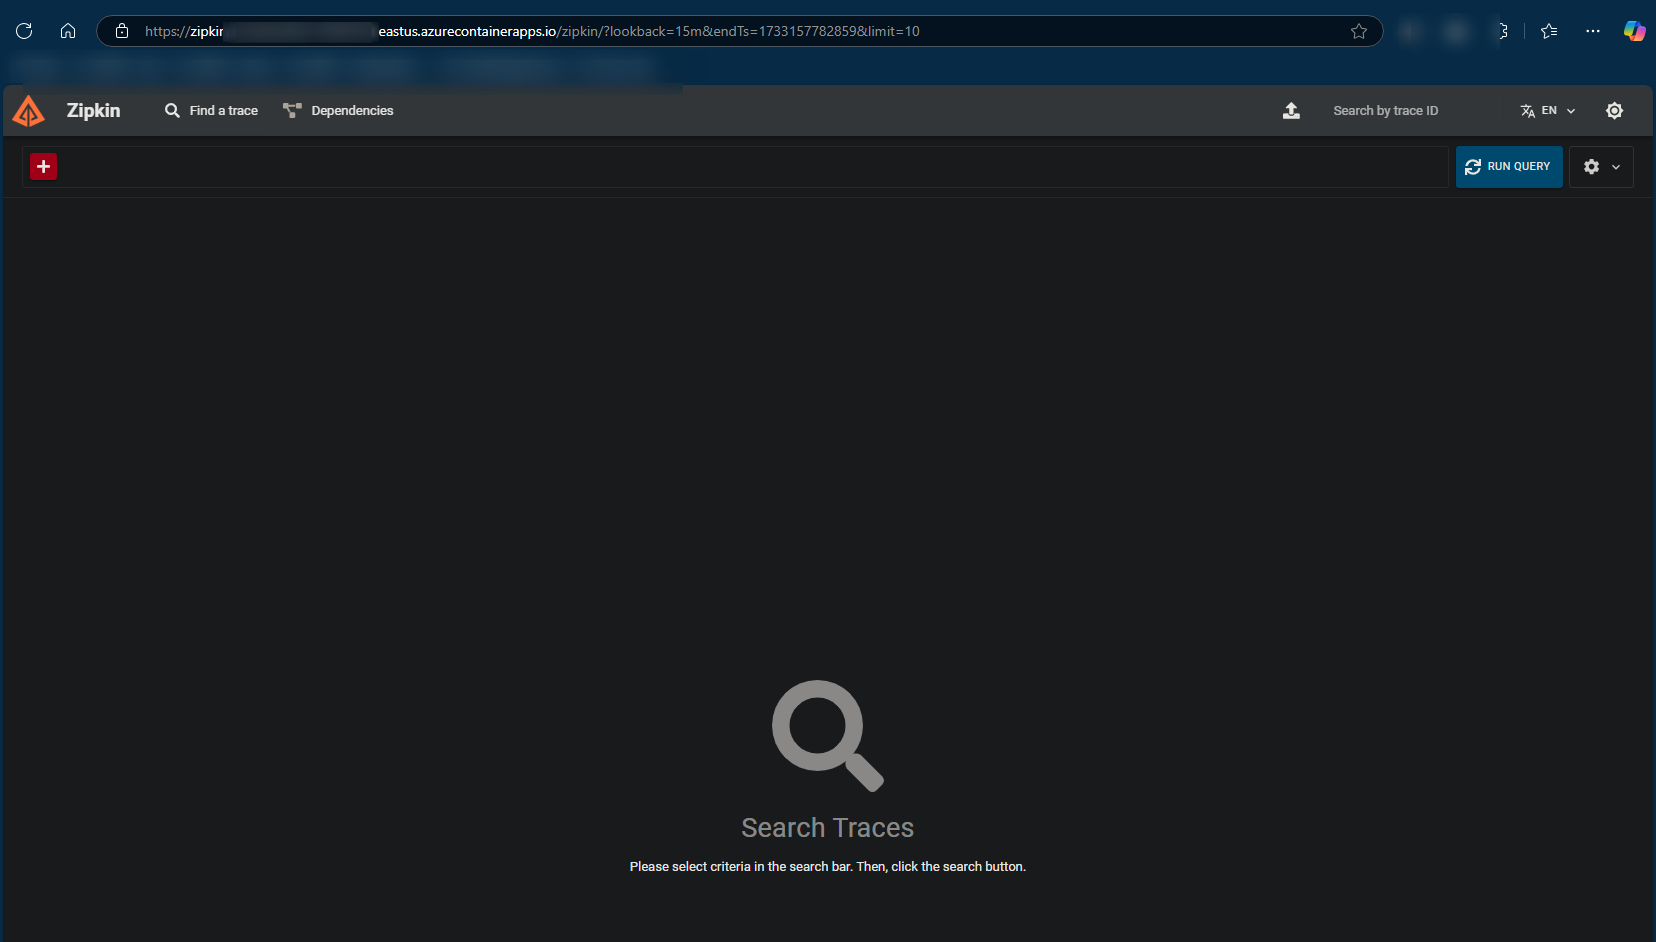
Zipkin should now be set up. If you navigate to your Zipkin Container App FQDN, you’ll see the default search page for traces.
Opentelemetry
We can use the opentelemetry Docker Hub image to quickly set up our collector. To make this work, this will require an Azure Storage account with Azure Files.
Alternatively, you could create your own image and override the default collector .yml file.
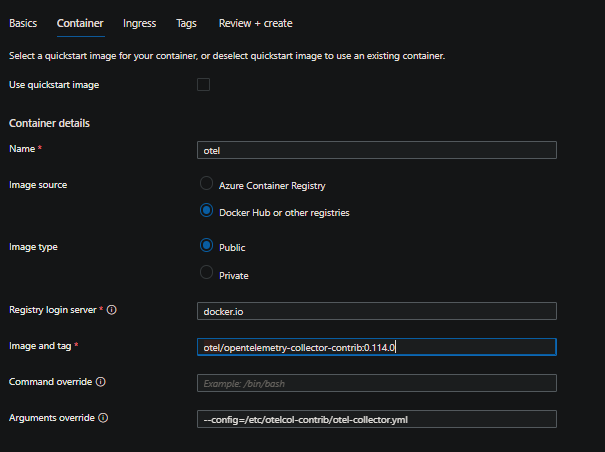
- Create a Container App using the following:
- Name: otel
- Image source: Docker Hub or other registries
- Image type: Public
- Registry login server:
otel/opentelemetry-collector-contrib:0.114.0. - Arguments override:
--config=/etc/otelcol-contrib/otel-collector.yml
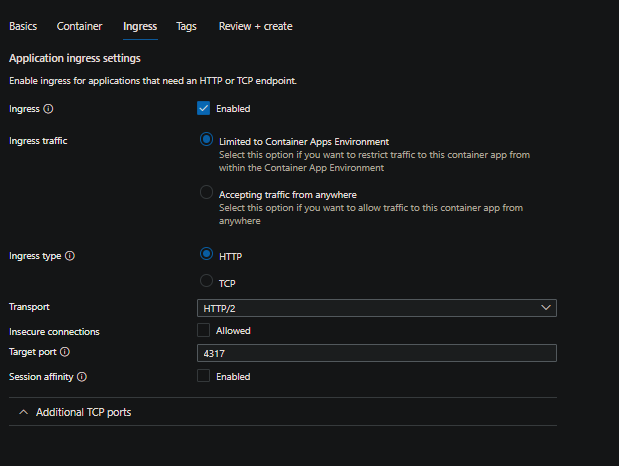
- Set the following:
- Ingress traffic: Limited to Container Apps Environment
- Ingress type: HTTP/2
- Target port: 4317
-
Create the Container App. After creation, navigate to the Scale blade and change the Min replicas count to one (1):

-
At this point, we need to create an Azure Files-based storage volume and mount it to our container in the pod.
- a) Create a file named
otel-collector.ymlwith the following contents and then upload it to an Azure File Share in your Azure Storage Account:
IMPORTANT: If you used a different name other than
zipkinfor the Container App, make sure to update the belowendpointvalue by replacing zipkin with the name of your Container App.receivers: otlp: protocols: grpc: endpoint: 0.0.0.0:4317 processors: batch: exporters: zipkin: endpoint: "http://zipkin/api/v2/spans" tls: insecure: true extensions: health_check: pprof: zpages: service: extensions: [health_check, pprof, zpages] pipelines: traces: receivers: [otlp] processors: [batch] exporters: [zipkin]-
b) Navigate to your Container App Environment -> Azure Files - and create a storage resource that references the Storage Account and File Share that the above
otel-collector.ymlfile resides in. Since we’re just referencing a singular.ymlthat’s only being read-in, this is set toread-only. This can be set toread-writeif desired.
- a) Create a file named
-
With the storage resource now created on the environment, we need to create a volume and mount it to the container
a) Go to the Container App -> Volumes - and add a new volume:
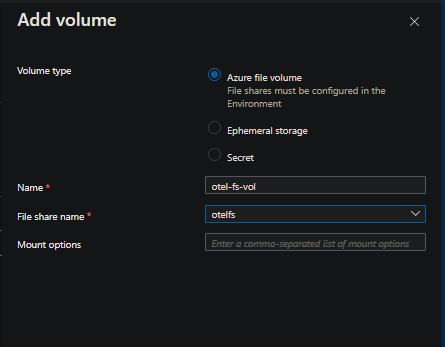
b) Go to the Container App -> Containers -> Edit and deploy -> select the “otel” container and choose Edit -> Volume mounts - and add a new volume to this container.
Choose the volume name that was added in the previous Volumes section (above) - set the Mount path to
/etc/otelcol-contrib:
- At this point, the collector should now be set up.
Client
-
Create your Container App. This example will be using a Flask application instrumented with the Open Telemetry Python SDK. Below is an example of what is being used in terms of instrumentation:
 def initialize_instrumentation():
     # Service name is required for most backends
     resource = Resource(attributes={
         SERVICE_NAME: os.getenv('OTEL_SERVICE_NAME',
                                 'otel-sdk-examples-python-sdk')
     })

     traceProvider = TracerProvider(resource=resource)

     if os.getenv('ENVIRONMENT') == 'dev':
         processor = BatchSpanProcessor(ConsoleSpanExporter())
     else:
         processor = BatchSpanProcessor(OTLPSpanExporter(
             endpoint=os.getenv('OTEL_EXPORTER_OTLP_ENDPOINT', 'localhost:4317')))

     traceProvider.add_span_processor(processor)
     trace.set_tracer_provider(traceProvider)

 ... other code ...
If the
ENVIRONMENTenvironment variable is set todev, we export telemetry to the console. Otherwise, we’ll use the OTLP exporter.Furthermore, if
OTEL_EXPORTER_OTLP_ENDPOINTis set, we’ll use that value, otherwise we use a default oflocalhost:4317 -
During Container App creation (or post-creation), set the following environment variables:
OTEL_EXPORTER_OTLP_ENDPOINT:https://otel.internal.funnyname-1234abc.yourregion.azurecontainerapps.io/- you can find your opentelemetry collector’s FQDN by going to the Ingress blade on the applicationOTEL_EXPORTER_OTLP_PROTOCOL:grpcOTEL_SERVICE_NAME: Set this to the name of your Container App
Validate tracing
Assuming everything is now properly set up, make a few requests to your client application - and then navigate to your Zipkin appliications FQDN. Select Run query - if this was properly set up and instrumented, traces should now populate:

Troubleshooting
It is heavily recommended to have either Log Analytics or Azure Monitor set up as log destinations. Or, another destination acting as a log collector.
Setting the log destination to “none” will not persist logging. See Log Options for details.
Collector troubleshooting
unsupported protocol scheme:
- You’re likely forgetting to include a protocol scheme (eg.
http://orhttps://) in theendpointproperty withinotel-collector.yml. Ensure this is a valid and resolvable URI.
context deadline exceeded:
- This can happen if you include a port within the URI. Typically, this would work in a setup such as
docker-composeor other Kubernetes implementations. But doing something such ashttp://zipkin:9411/api/v2/spanswithin yourendpointproperty will cause this error. Ommiting the port (ex.http://zipkin/api/v2/spans) resolves this - This may also happen if trying to target a backend that is simply not reacheable due to network traffic being blocked. You can attempt to use
curlor other tooling to validate it’s reacheable.
If the collector container is exiting or failing to start and you want to view general stdout/err, query the ContainerAppConsoleLogs_CL table (Log Analytics) or ContainerAppConsoleLogs table (Azure Monitor), for example:
ContainerAppConsoleLogs_CL
| where ContainerAppName_s == "otel"
| project TimeGenerated, Log_s, ContainerGroupName_s
For container or pod lifecycle events, you can use ContainerAppSystemLogs_CL or ContainerAppSystemLogs
Application troubleshooting
The way to go about this may depend on the language and if using the SDK or the codeless agent. As a first attempt, you can increase verbosity of opentelemetry logging through the OTEL_LOG_LEVEL environment variable.
However, you still may need to configure stdout/err from the application, if in the case the above variable doesn’t change logging. For example, with our Python application using the SDK, the below additional set up is needed to see opentelemetry SDK errors and logging:
# Attach OTLP handler to root logger
logging.getLogger().addHandler(handler)
# Add a handler to see logging to console
logging.getLogger().addHandler(logging.StreamHandler())
logging.basicConfig(level=logging.INFO)
Other languages may vary.
StatusCode.UNAVAILABLE encountered while exporting logs to [somendpoint]
- If this is repeating and telemetry is not appearing in Zipkin, this may be due to an invalid/incorrect URI set for the
OTEL_EXPORTER_OTLP_ENDPOINTvariable.
StatusCode.UNIMPLEMENTED
-
This may not actually directly indicate an error. With our Zipkin example, we’re only setting this up to accept traces. If we’re also trying to export logging and metrics from our application, for example, even though the collector isn’t set to collect/export these - we’ll see this error.
Failed to export logs to otel.internal.funnyname-123abc.youregion.azurecontainerapps.io, error code: StatusCode.UNIMPLEMENTED
-
Ensure if wanting to capture metrics and logs (or other telemetry types), that this is correctly configured through the opentelemetry collector under
service.pipelines. If the backend doesn’t accept types of metrics or logs (as an example with Zipkin’s case here), you can potentially resolve these errors by setting the environment variablesOTEL_METRICS_EXPORTER=noneandOTEL_LOGS_EXPORTER=none- or - by programmatically excluding these.
For all other troubleshooting, ensure to review application logs through the ContainerAppConsoleLogs_CL or ContainerAppConsoleLogs table. For container or pod lifecycle events, you can use ContainerAppSystemLogs_CL or ContainerAppSystemLogs


