CPU usage metrics for Container Apps and single threaded applications
This post will cover looking at CPU metrics for single threaded applications experiencing high CPU and why there may be differences depending on the CPU core count
Overview
tldr: If a single threaded language or runtime (like Node.js) or Python is being used, and the container is allocated > 1 cpu (ex. 2), and the application is consuming 100% CPU, it will only how as 50% - or whatever is the equivalent of 1 core out of all cores defined.
When viewing CPU usage for single threaded applications, the data shown may look different and possibly confusing depending on the number of cores that are allocated to a container. For example, the node.js runtime is by default single-threaded as well as Python. However, both of these can utilize multiple CPU cores through Node.js clustering and Python’s multiprocessing. If troubleshooting CPU usage for an application - confirm if it’s a single threaded language and confirm whether or not clustering/multiprocessing (or for any other language the relevant mechanism for multicore usage) is being used.
The below examples and descriptions imply non-clustering/multiprocessing, etc. is being used. Additionally, the application code is causing 100% CPU usage to prove an example. If a single threaded application was using this, then you’d see your typical > 100% CPU usage (eg. 200%) if > 1 cpu is allocated to a container.
All of this CPU data can be seen in the following builtin metrics in the Azure Container App portal:
- Metrics -> CPU Usage
- Metrics -> CPU Usage Percentage
- Diagnose and Solve Problems -> Container App CPU Usage
Take the below example(s)
- This container is set to use
0.5CPU (half a core). It is fundamentally hitting 100% CPU usage. Since all of0.5core is used, it’s 100% usage.
- If you switch to looking at nancores with the CPU usage metric (not percentage), you see it’s capped at 0.5. Which again, is 100% usage
If you go into the container via Console and use top, you can see it’s at 50% usage. Which makes sense, since only 50% of a whole core is allocated to this container - and 50% is being used.
This is the same if 1 core is allocated as well (as seen in the below screenshot). Essentially for any scenario where =< 1 core is set for a container when it comes to single threaded applications, the above will be true, where you will generally see a clearcut “100% CPU” usage case.
The next examples below is where it may skew a bit:
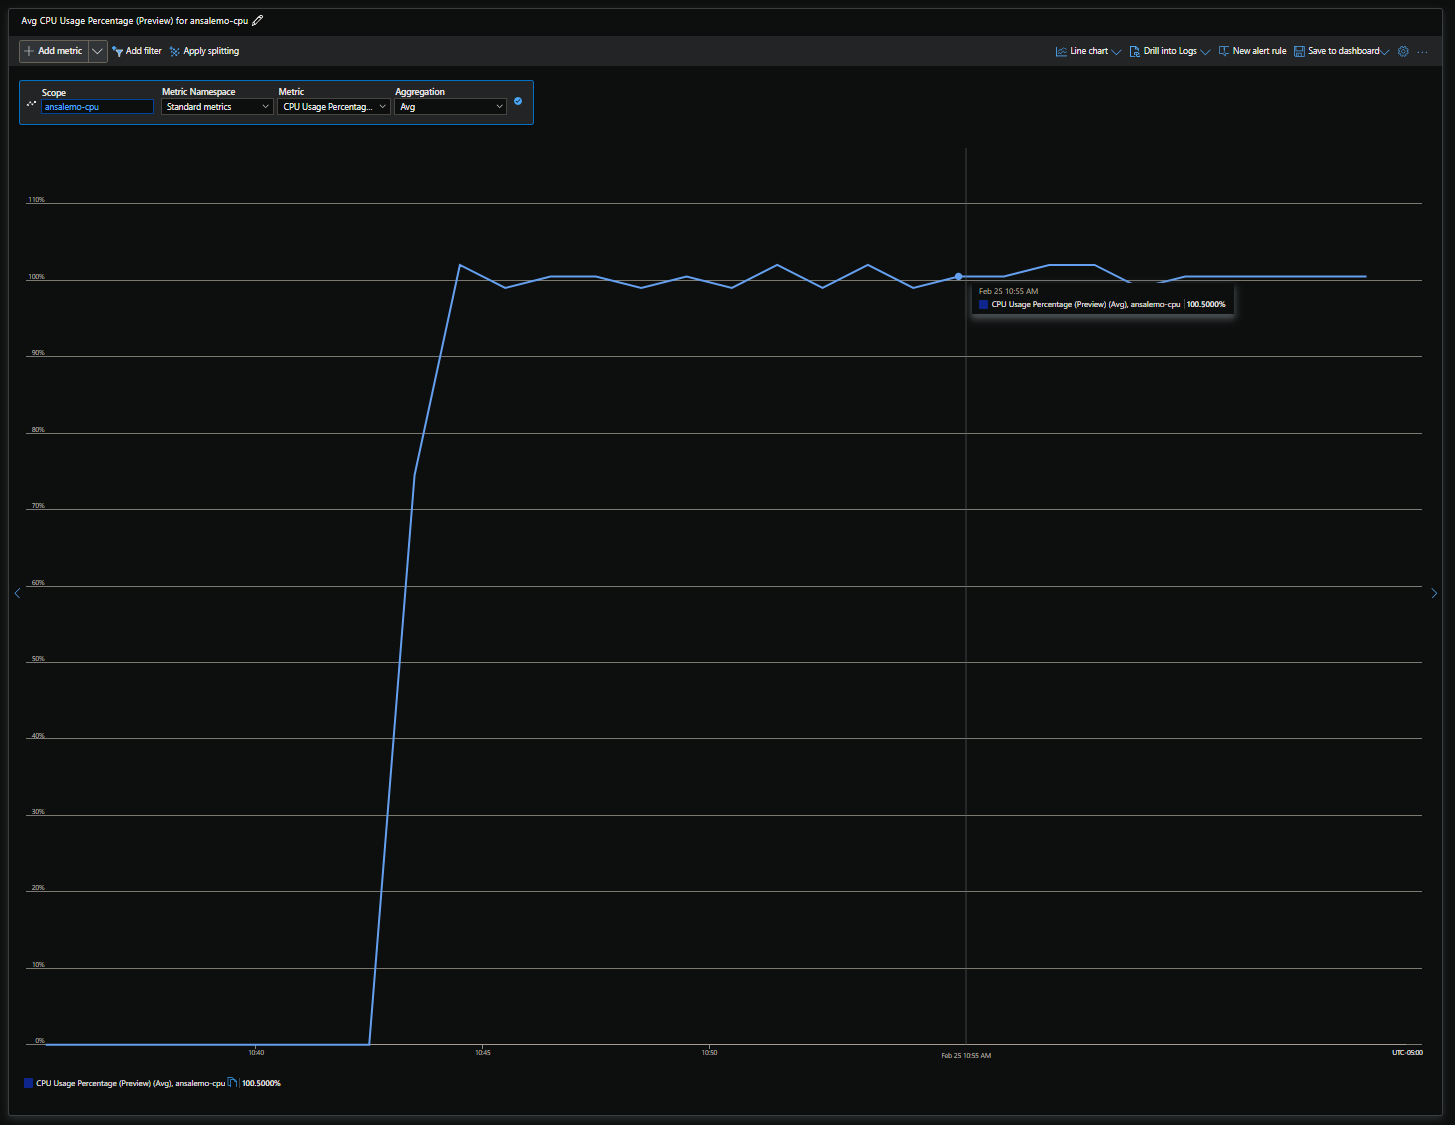
- Take the below example where
2 cpuis allocated to a container.

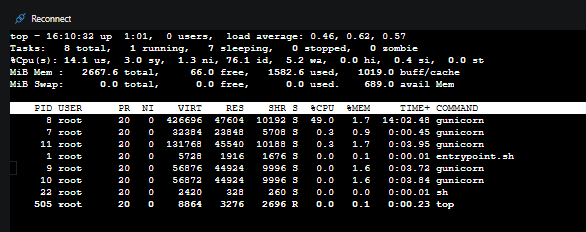
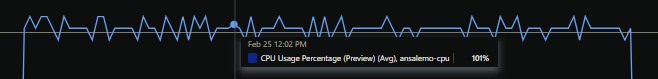
However, now we see only 50% usage when viewing through CPU usage (preview). But, this is still technically 100% CPU usage. Why? Because in this Python applications case (not using multiprocessing modules), it is by default using Python’s single-threadedness, and is only executed in the content of a singular core. So even though there is 2 cpu (cores), only 1 is ever going to be utilized, so in this case, half of two (2) is 50% here. If you go back in top, you also see this is 100% usage (as opposed to 50% from before with 0.5 cpu):
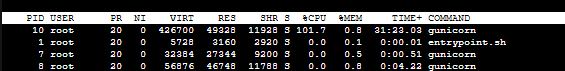
- Why is this 100% but not in the previous case when it was
0.5 cpuand showing 50%? Because in this case, there is 2 cores now allocated for the container (as opposed to before it was just .5 of a core). Since the Python process is executing in the context of just one (1) of these two (2) cores - it will end up using 100% of that available core now. One full core can be thought as of100%- 2 cores would be200%, but as explained above, does not mean all 200% of it is going to be used here.