‘no space left on device’ with Azure Container Apps
This post will cover the message ‘no space on device’ that you may end up seeing when deploying Container Apps, or in other runtime scenarios.
Overview
no space left on device is a relatively well-known error that can happen, and in this context, wherever Linux-based programs are run. It will happen if a storage location gets full, with the error indicating that the location no longer has space to write/store any further data. This in itself is not specific to Azure Container Apps, but can surface here due to two core reasons:
- Image size
- A container(s) writing a large amount of files (eg. cache, large files, numerous files, etc.) to the container filesystem. The importance with this is writing to the local filesystem, not a mounted volume with Azure Files. Data written to a volume persisted with Azure Files stores its data there, on the file share. Data written to the local container filesystem stores its data in a shared location with where layers are stored on the host. This is otherwise known as the “thin writeable layer” commonly talked about with containers, in general
- Another side to this is if using Ephemeral Volumes, you may also see this kind of
no space left on device-equivalent issue, except, the pod will beEvicteddue to hitting storage limits. As shown in the above link, the volume size is dependent oncpuallocated to the container.
- Another side to this is if using Ephemeral Volumes, you may also see this kind of
The above can happen to both Jobs and Container Apps
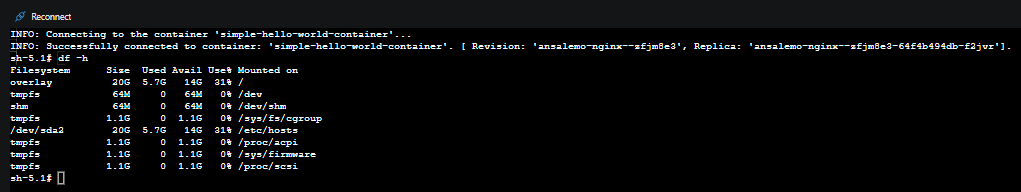
Available profile types can be found here. The below show examples of disk space on different profiles, which you can see with df -h
(Consumption)
(d4)
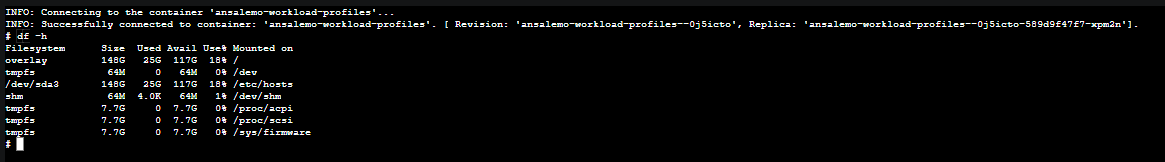
As SKU sizes increase, so does disk space.
In terms of storage, overlay is what will cause this issue, when full. Note, it is completely expected that there will be some usage on overlay already, regardless of image size. Since this location is a mount point on the host, it cannot be directly accessed.
Findings these errors
You can find these errors in either Log Stream, Azure Monitor or Log Analytics. For Log Options in Container Apps, review Log storage and monitoring options in Azure Container Apps
In Azure Monitor, it’ll be in the ContainerAppSystemLogs table. For Log Analytics, it’ll be in the ContainerAppSystemLogs_CL table.
This may show directly during image pull progress - the other side to this may be during container creation, if the disk space is full at the time of container create, this message will show.
In either case, it’ll look like the below:
OCI runtime create failed: runc create failed: unable to start container process: error during container init: error mounting \"/some/path" to rootfs at \"/somepath\": mkdir /mnt/to/somepath: no space left on device: unknown"}
Or simply:
no space left on device: unknown
Image size
Maximum image sizes are called out here.
Maximum image size:
- Consumption workload profile supports container images totaling up to 8GB for each app or job replica.
- Dedicated workload profiles support larger container images. Because a Dedicated workload profile can run multiple apps or jobs, multiple container images share the available disk space. The actual supported image size varies based on resources consumed by other apps and jobs.
The reason for the above is due to the difference in hosting mechanisms between Consumption and Workload profiles.
Since Workload profiles can be thought of as the more typical “node” based approach where pods/replicas using a profile will be scheduled across these, this is where the notion of multiple container images share the available disk space comes from (mentioned above).
Best practices (In general):
- Always try to use a smaller image where possible. This may mean using
alpineorslimbased image distro variants over full-fledged distributions like:ubuntu,:debian, etc. Check if your base image(s) support smaller variant tags.- A caveat is that the smaller variantes like Alpine will be using
apkpackage manager (so therefor if switching from another distro, you may need to update yourDockerfileand other.shscripts) - and, most importantly - certain tooling may not be available/installed by default, since the idea is to keep it small - Also, Alpine uses
muslas the C standard library instead ofglibcwhich you may see on other distro’s. This may not affect most applications, but should be kept in mind. Especially if the application is relying on shared libraries or lower-level C bindings.
- A caveat is that the smaller variantes like Alpine will be using
-
Use multi-stage images. For more context, see multi-stage builds. Multi-stage builds can save much needed size by only copying what is needed from a previous build into the current builds context, and discarding the rest - instead of creating one large build. For example:
FROM maven:3.9.0-eclipse-temurin as build WORKDIR /usr/src/app COPY . /usr/src/app RUN mvn -f /usr/src/app/pom.xml clean package -DskipTests FROM eclipse-temurin:17.0.14_7-jre WORKDIR /usr/src/app COPY --from=build /usr/src/app/target/probes-0.0.1-SNAPSHOT.jar probes-0.0.1-SNAPSHOT.jar COPY --from=build /usr/src/app/init_container.sh init_container.sh COPY --from=build /usr/src/app/certs /usr/src/app/certs- This builds the above Java application with Maven to produce a
.jarfile, we only copy just that and some other files over to the current runtime build. - This saves space by avoiding the need to include Maven and all it’s other dependencies as a dependency itself in the image.
- This builds the above Java application with Maven to produce a
- Use
.dockerignore(or your container management tools equivalent). Think of this like a.gitignorebut for the files that get put into your image. This can reduce many files in certain circumstances and save on overall image size. See .dockerignore files. If using Podman, use .containerignore - Consider using only runtime environments instead of full development kits (SDKs). If full SDKs (or JDK’s) aren’t required - consider using the runtime only environment equivalent. For Java, this is typically images that include a
jretag, for .NET this is ones with a image name contant justaspnet:some.version- see here for an explaination on that - If hitting this issue, and you want to check your image size, look at the uncompressed image size, not the compressed size. When layers are pulled, the compressed image (stored in a registry) has it’s layers downloaded and uncompressed, so this size is what matters. To check an image size effectively, pull it to your local machine if it doesn’t already exist and run the below commands:
docker inspect -f "{{ .Size }}" someimage:sometag- This outputs the uncompressed size in bytesdocker inspect -f "{{ .Size }}" someimage:sometag | numfmt --to=si- This outputs the uncompressed size in human readeable formatdocker image ls someimage:sometag
Below are some examples of using this on a local image:
$ docker inspect -f "{{ .Size }}" pythonfastapi:large
12155661241

$ docker image ls pythonfastapi:large
REPOSITORY      TAG       IMAGE ID       CREATED      SIZE
pythonfastapi   large     ab7065c19777   6 days ago   12.2GB

$ docker inspect -f "{{ .Size }}" pythonfastapi:large | numfmt --to=si
13G
There are times that you may have to rely on a 3rd party image, where you have no control over the image size. This may be likewise for certain images that are primarily AI/ML focused that inheritly have large library sizes. If there are no tags that are more slim/smaller that can be taken advantage of, then consider using Workload Profiles and using a larger SKU size.
Runtime
This refers to the second bullet point in the overview section about containers creating files at runtime.
If an application generates a large cache (and consistently adds to it), or essentially any other operation which over time, creates a large amount of files, while writing to the local filesystem, then they are subject to hitting this at runtime if the amount of files consume storage significantly over time.
One additional scenario is when using Container App Jobs and using a CI/CD runner that may have it’s pipeline write a large amount of data to disk, no space left on device may occur during those
These issues may be more tough to investigate since if the container is restarted, whatever was written to disk is now discarded. However, prior to hitting this (and knowing that this is an issue for the application), you can go into Console which connects to a shell in your container, and can use either:
df -hfind- you can use something likefind / -type f -exec du -Sh {} + | sort -rh | head -n 5- where/is the directory you want to list out topndirectory sizes-
du- such as ` du -a /tmpsort -n -r head -n 5 - where/tmpis the directory you want to list out topn` directory sizes ls -lrtah- wherehshows human readeable file size format
If you want to list out greater than top 5, replace 5 with n - for example, -n 100.
Or, a mix of other commands to find current disk space usage and which directory may be consuming the most storage space. This can be done in much more varying ways that can fit your use case/need.
NOTE: The above is not available for Jobs, since there is no Console access
If this cannot be done, testing this in a more local or controlled environment (for example, on a Linux VM but outside of a container so files are persisted to the VM disk) and doing application investigation will be required to understand what is being written to disk that is causing this issue.
Aside from identifying the files/directories itself from your container which are contributing to used up disk space, the below can be done:
- Use workload profiles, instead of consumption, and use a higher SKU is needed
- If the files themselves are not cache related and are not expecting to be discarded, then consider using AzureFiles through a storage volume to store this data on. Note, using AzureFiles to store temporary files is not recommended in this case.
- If these files are cache related - and are temporary files - consider implementing some type of cleanup mechanism at
xinterval or directory file size.- Note, this would imply that the core reason/location as to why such a large amount of files being generated are known in the first place
All of the above also applies to using Ephemeral Volumes, although the error may not be no space left on device but rather something like the below which can also be found in system logs:
Container somecontainer exceeded its local ephemeral storage limit "[some_size]".Pod ephemeral local storage usage exceeds the total limit of containers [some_size].


