Troubleshooting Node.js High CPU scenarios in App Service Linux
When dealing with High CPU scenarios in App Service Linux, the best recommendation is to profile your app in your local environment, but sometimes it is hard to reproduce the issue specially not having the same request load or environment. For those scenarios you can configure a Node.js profiler for your application. These profilers can be divided in two main categories: Built-in profilers and Third-Party Profilers.
You can find information for High Memory in this reference.
Built-in profilers
These profilers are part of the Node.js installation. Some of them are installed for specific node.js version. The advantage of these profilers is that you don’t need to install any library or configure in your package.json, these profilers options uses the V8 Profiler (sample-based). A disadvantage is that you can’t profile specific function or code, it will profile the entire application for that you might need to use Third-Party profilers.
In this category you will find the following profilers:
node –cpu-prof
Node.js V8 Built-in Profiler. You can run a V8 CPU profiler on startup and writes the CPU profile to disk before exit.
Important: This flag was incorporated in Node.js >=12 versions.
To configure this profiler on App Service Linux you need the following steps:
-
Implement a method that exits the nodejs process
You need to add an endpoint or code to end the node.js process with status 0 or 1. Status 0 is success. Check the Node.js’s reference for more details.
   app.get('/end', function(req, res){
     process.exit(0);
   });
Or implement user-defined signals (SIGUSR1 or SIGUSR2):
   process.on('SIGUSR2', () => {
     process.exit(0);
   });
And get the process id for node app and send the signal through SSH like this:
   ps auxw | grep "node"

   kill -USR2 <pid>
The reason for exiting the node.js process from code is that the built-in profiler generates the output after exiting the process or terminating its execution, but since you are using a webserver and not a single script, you need this step. Restart or killing the process from SSH will not work here.
-
Use Startup Command or Custom Startup Script
Update the startup command from Azure Portal -> Select your web app -> Click on Configuration -> Then General Settings -> Update the Startup Command textbox with:
node --cpu-prof <entrypoint>.js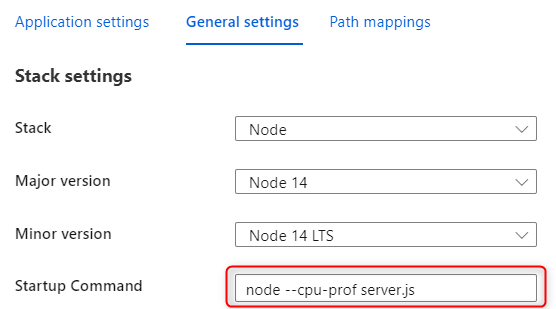
-
Generating a *.cpuprofile file
After reproducing the issue, then you call this endpoint to exit nodejs process or Linux User Signals. A new file will be generated having this syntax:
CPU.${yyyymmdd}.${hhmmss}.${pid}.${tid}.${seq}.cpuprofile.There are other parameters that you can pass within this flag as if you want to change the name, directory, and interval:
- –cpu-prof-dir: Specify the directory where the CPU profiles generated by –cpu-prof will be placed. The default value is controlled by the –diagnostic-dir command-line option.
- –cpu-prof-name: Specify the file name of the CPU profile generated by –cpu-prof.
- –cpu-prof-interval: Specify the sampling interval in microseconds for the CPU profiles generated by –cpu-prof. The default is 1000 microseconds.
As an example:
node --cpu-prof-dir "/home/LogFiles/" --cpu-prof-name "mynew.cpuprofile" --cpu-prof server.js -
Download the *.cpuprofile
You can use the new Kudu experience
https://mysite.scm.azurewebsites.net/newui/fileManagerand navigate through the folders. -
Analyze the .cpuprofile
You can type in Chrome browser
chrome://inspect/or with Edgeedge://inspect, and then click onOpen dedicated DevTools for Node. Then selectProfilertab and load the*.cpuprofilefile. And use different views as Chart, Heavy (Bottom up) or Tree.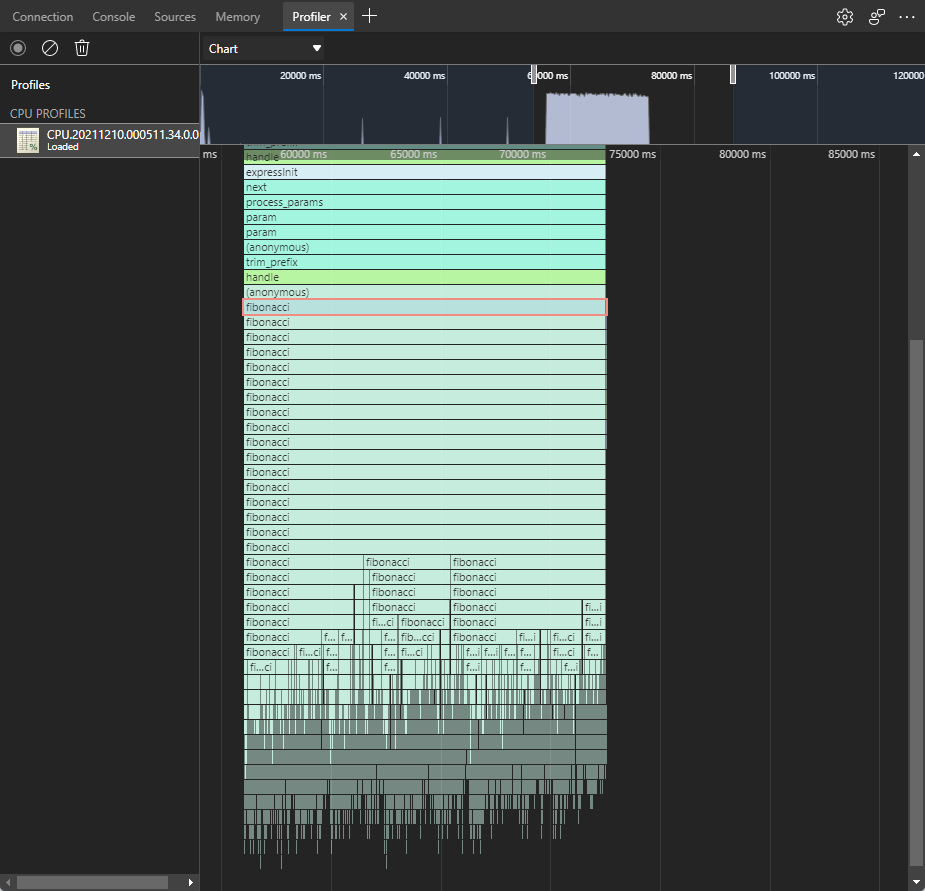
node –prof
Node.js V8 built-in profiler. This built-in profiler uses the profiler inside V8 which samples the stack at regular intervals during program execution. It records the results of these samples, along with important optimization events such as jit compiles, as a series of ticks. This is mostly useful just for CPU traces.
To configure this profiler, you need the following steps:
-
Use Startup Command or Custom Startup Script
Update the startup command from Azure Portal -> Select your web app -> Click on Configuration -> Then General Settings -> Update the Startup Command textbox with:
node --prof server.js -
Replicate the issue
This will create new file
isolate-0xnnnnnnnnnnnn-v8.logfor every new process. If you restart your site, it will generate a new file inside under/home/site/wwwroot.Important: You need to restart your site to release the file to download it.
-
Download the trace
Download this file from Kudu site using File Manager or vfs
https://<sitename>.scm.azurewebsites.net/api/vfs/site/wwwroot/. -
Process v8.log
To make sense of this file, you need to use the tick processor bundled with the Node.js binary. To run the processor, use the
--prof-processflag or you can use a flamegraph to visualize and explore performance profiling results.-
Using –prof-process
Running the following command:
node --prof-process isolate-0xnnnnnnnnnnnn-v8.log > processed.txtAn example of the log output can be the following:
          Statistical profiling result from isolate-000001DF5E56C1F0-v8.log, (4317 ticks, 327 unaccounted, 0 excluded).

          [Shared libraries]:
          ticks  total  nonlib   name
          2098   48.6%          C:WSM32
          tdll.dll
              15    0.3%          C:am Files
          odejs
          ode.exe

          [JavaScript]:
          ticks  total  nonlib   name
          1100   25.5%   49.9%  LazyCompile: *fibonacci C:sTrainingerver.js:5:19
              392    9.1%   17.8%  Builtin: Equal
              201    4.7%    9.1%  Builtin: Subtract
              113    2.6%    5.1%  Builtin: LessThan
              69    1.6%    3.1%  Builtin: GreaterThan
              1    0.0%    0.0%  LazyCompile: ~fibonacci C:sTrainingerver.js:5:19
              1    0.0%    0.0%  Builtin: KeyedLoadIC

          [C++]:
          ticks  total  nonlib   name

          [Summary]:
          ticks  total  nonlib   name
          1877   43.5%   85.2%  JavaScript
              0    0.0%    0.0%  C++
              0    0.0%    0.0%  GC
          2113   48.9%          Shared libraries
              327    7.6%          Unaccounted

          [C++ entry points]:
          ticks    cpp   total   name

          [Bottom up (heavy) profile]:
          Note: percentage shows a share of a particular caller in the total
          amount of its parent calls.
          Callers occupying less than 1.0% are not shown.

          ticks parent  name
          2098   48.6%  C:WSM32
          tdll.dll

          1100   25.5%  LazyCompile: *fibonacci C:sTrainingerver.js:5:19
          1100  100.0%    LazyCompile: *fibonacci C:sTrainingerver.js:5:19
          1100  100.0%      LazyCompile: *fibonacci C:sTrainingerver.js:5:19
          1100  100.0%        LazyCompile: *fibonacci C:sTrainingerver.js:5:19
          1100  100.0%          LazyCompile: *fibonacci C:sTrainingerver.js:5:19
          1100  100.0%            LazyCompile: *fibonacci C:sTrainingerver.js:5:19

              392    9.1%  Builtin: Equal
              392  100.0%    LazyCompile: *fibonacci C:sTrainingerver.js:5:19
              392  100.0%      LazyCompile: *fibonacci C:sTrainingerver.js:5:19
              392  100.0%        LazyCompile: *fibonacci C:sTrainingerver.js:5:19
              392  100.0%          LazyCompile: *fibonacci C:sTrainingerver.js:5:19
              392  100.0%            LazyCompile: *fibonacci C:sTrainingerver.js:5:19

              327    7.6%  UNKNOWN

              201    4.7%  Builtin: Subtract
              201  100.0%    LazyCompile: *fibonacci C:sTrainingerver.js:5:19
              201  100.0%      LazyCompile: *fibonacci C:sTrainingerver.js:5:19
              201  100.0%        LazyCompile: *fibonacci C:sTrainingerver.js:5:19
              201  100.0%          LazyCompile: *fibonacci C:sTrainingerver.js:5:19
              201  100.0%            LazyCompile: *fibonacci C:sTrainingerver.js:5:19

              113    2.6%  Builtin: LessThan
              113  100.0%    LazyCompile: *fibonacci C:sTrainingerver.js:5:19
              113  100.0%      LazyCompile: *fibonacci C:sTrainingerver.js:5:19
              113  100.0%        LazyCompile: *fibonacci C:sTrainingerver.js:5:19
              113  100.0%          LazyCompile: *fibonacci C:sTrainingerver.js:5:19
              113  100.0%            LazyCompile: *fibonacci C:sTrainingerver.js:5:19

              69    1.6%  Builtin: GreaterThan
              69  100.0%    LazyCompile: *fibonacci C:sTrainingerver.js:5:19
              69  100.0%      LazyCompile: *fibonacci C:sTrainingerver.js:5:19
              69  100.0%        LazyCompile: *fibonacci C:sTrainingerver.js:5:19
              69  100.0%          LazyCompile: *fibonacci C:sTrainingerver.js:5:19
              69  100.0%            LazyCompile: *fibonacci C:sTrainingerver.js:5:19
To understand the following output, you can divide it into several parts:
- The first part Summary will tell you the percentage of CPU spent in JavaScript or C++ or Shared Libraries, etc.
- In case it spends in C++, you can go into that section and review the calls.
- In case it spends on Shared Libraries, you can go into that section and review the components.
- In case it spends on JavaScript, you can go into that section and review the functions/methods being call and line of code.
- To better understand the relationships between functions and methods, you can see the [Bottom up (heavy) profile] section which provides information about the primary callers of each function, in this example, it is fibonacci function.
Note: You will see ticks column, which tick refers to each iteration of an Event Loop.
-
Using flamegraphs:
-
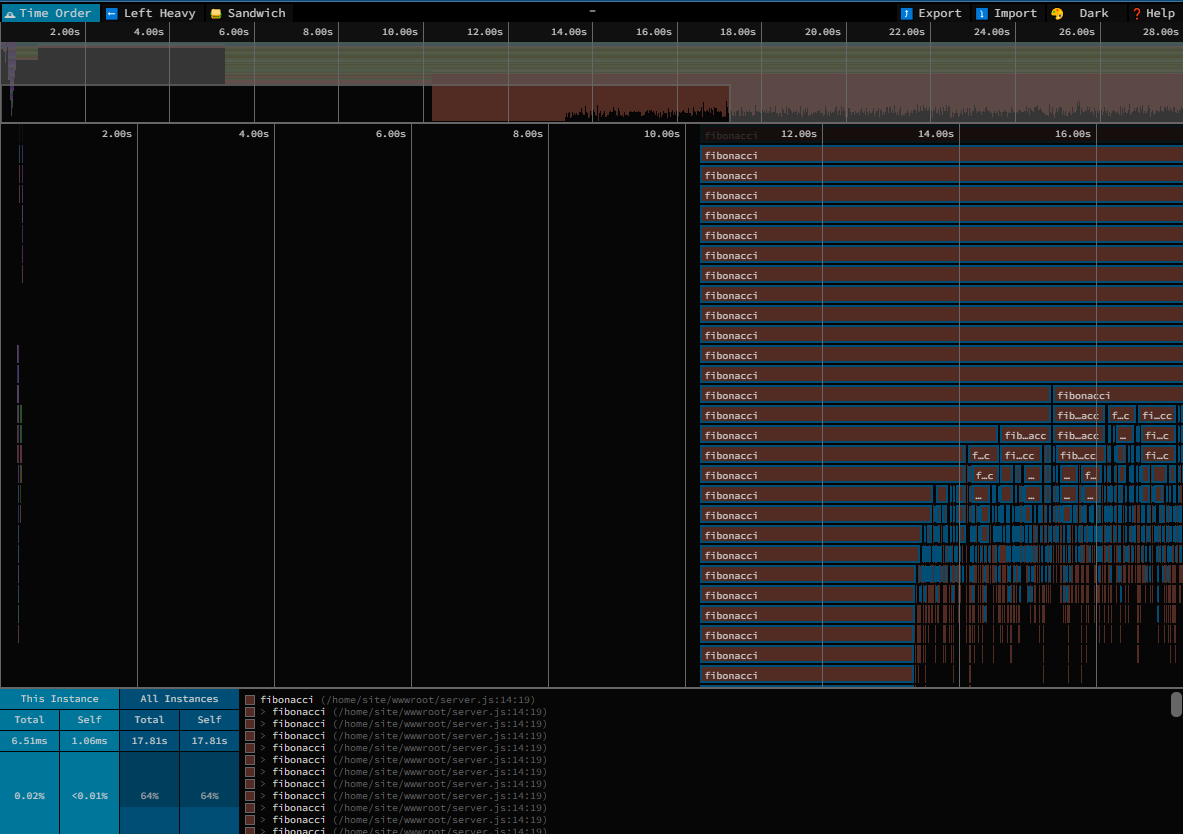
a) You can convert the profile trace into a json file that can be imported into speedscope like so:
node --prof-process --preprocess -j isolate*.log > profile.v8log.jsonb) Then you can use online version or use offline method installing:
npm install -g speedscopec) Call speedscope directly with:
speedscope /path/to/profile.v8log.jsonOr you can also pipe the output of
node --prof-processdirectly to speedscope with a trailing-like this without doing the conversion in step number 1:node --prof-process --preprocess -j isolate*.log | speedscope -Output:
-
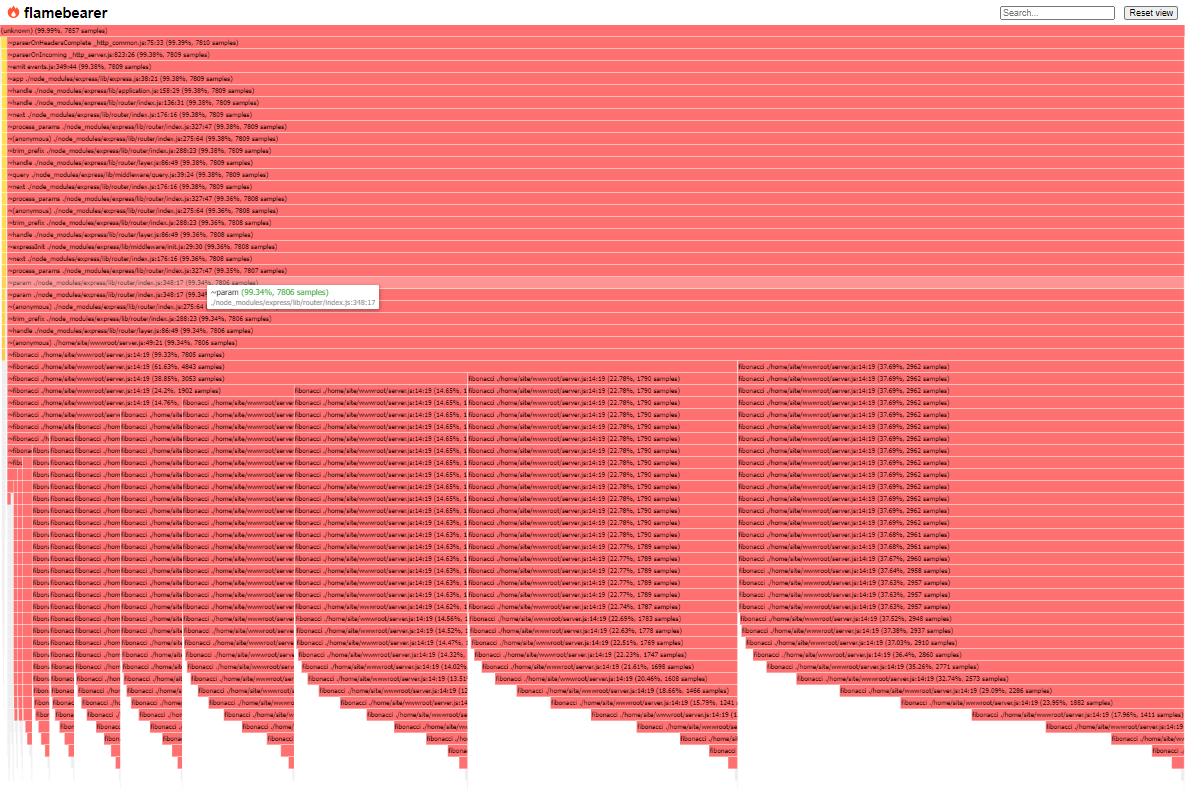
a) You can use the online version or offline method install the library:
npm install -g flamebearerb) Then pipe the output of
node --prof-processdirectly to flamebearer with a trailing-like this:node --prof-process --preprocess -j isolate*.log | flamebearer -Output:
-
-
Third-Party Profilers
You can find different third-party profilers available in npm repository. In this article we are going to cover just one of them.
The advantage of using third-party profilers is for you to take control and just profile specific functions that you think are causing the High CPU, instead of profiling all your code as you do it with Built-in profilers. If you want to profile the entire application review Built-in profilers.
v8-profiler-node8
-
To install v8-profiler-node8 module, run the following command:
npm install v8-profiler-node8 -
To import the module, you can use the following code line:
var profiler = require('v8-profiler-node8'); -
You will need to start/stop the profiler in the application page or function that you think it is taking more CPU time.
If you want to save the profiler in a specific folder location, you will need
fslibrary:const fs = require('fs'); let id = "<name>"; profiler.startProfiling(id); //Here is your possible code that is taking High CPU functionTakingCPU(); let profile = profiler.stopProfiling(id); fs.writeFile(__dirname + '/profiles/' + id + '.cpuprofile', JSON.stringify(profile), function () { console.log('CPU Profile data saved...'); });Note: It is important to keep always .cpuprofile extension.
-
To analyze this profile you can type in Chrome browser
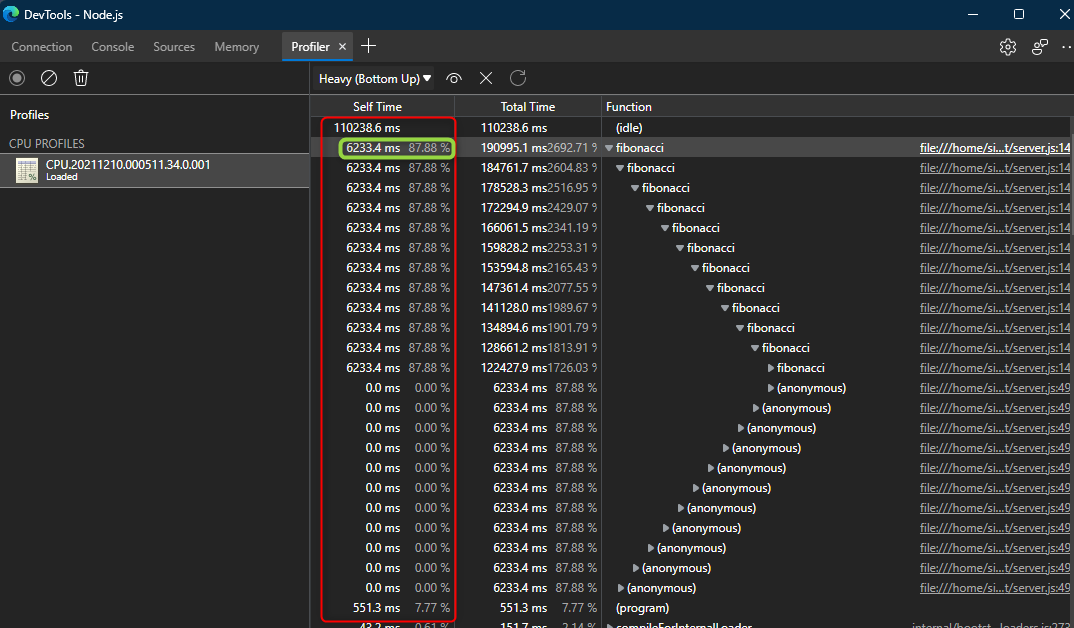
chrome://inspect/or with Edgeedge://inspect, and then click onOpen dedicated DevTools for Node. Then selectProfilertab and load the*.cpuprofilefile. And use different views as Chart, Heavy (Bottom up) or Tree.You will find columns as Self Time, Total Time, Function (File location) as well as Chart and Trees.
Self Time: Represents the amount of time spent in the function at the current level of a call tree.
Total Time: It is the self time + the amount of time it took to execute the code in functions that the current level calls.
You will be looking here for the function that has a high self time. You can probably find a function that has high self time because it is called a lot of times, you need to review if this function is optimized or not from your perspective and doesn’t mean that is performing bad.
You can find another example of this v8-profiler-node8 library in our Microsoft Tech Community’s Blog.
-
For troubleshooting High Memory scenarios in Azure App Service Linux follow the next reference.
-
For troubleshooting High Memory/CPU in Azure App Service Windows follow the next references:


