Troubleshooting Node.js High Memory scenarios in App Service Linux
When dealing with High Memory scenarios in App Service Linux, the best recommendation is to profile your app in your local environment, but sometimes it is hard to reproduce the issue specially not having the same request load or environment. For those scenarios you can configure a Node.js profiler for your application. These profilers can be divided in two main categories: Built-in profilers and Third-Party Profilers.
You can find information for High CPU in this reference.
Built-in profilers
These profilers are part of the Node.js installation. Some of them are installed for specific node.js version. The advantage of these profilers is that you don’t need to install any library or configure in your package.json, these profilers options uses the V8 Profiler HeapProfiler/HeapSnapshot classes. A disadvantage is that you can’t profile specific function or code, it will profile the entire application for that you might need to use Third-Party profilers.
In this category you will find the following profilers:
node –heap-prof
Node.js V8 Built-in Profiler. You can run a V8 heap profiler on startup and writes the heap profile to disk before exit.
Important: This flag was incorporated in Node.js >=12 versions.
To configure this profiler on App Service Linux you need the following steps:
-
Implement a method that exits the nodejs process
You need to add an endpoint or code to end the node.js process with status 0 or 1. Status 0 is success. Check the Node.js’s reference for more details.
   app.get('/end', function(req, res){
     process.exit(0);
   });
Or implement user-defined signals (SIGUSR1 or SIGUSR2):
   process.on('SIGUSR2', () => {
     process.exit(0);
   });
And get the process id for node app and send the signal through SSH like this:
   ps auxw | grep "node"

   kill -USR2 <pid>
The reason for exiting the node.js process from code is that the built-in profiler generates the output after exiting the process or terminating its execution, but since you are using a webserver and not a single script, you need this step. Restart or killing the process from SSH will not work here.
-
Use Startup Command or Custom Startup Script
Update the startup command from Azure Portal -> Select your web app -> Click on Configuration -> Then General Settings -> Update the Startup Command textbox with:
node --heap-prof <entrypoint>.js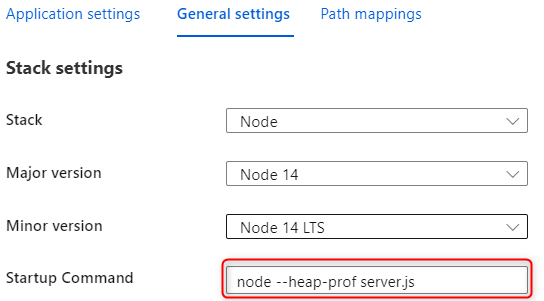
-
Generating a *.heapprofile file
After reproducing the issue, then call this endpoint to exit node.js process. A new file will be generated having this syntax:
Heap.${yyyymmdd}.${hhmmss}.${pid}.${tid}.${seq}.heapprofile.There are other parameters that you can pass within this flag as if you want to change the name, directory, and interval:
- –heap-prof-dir: Specify the directory where the heap profiles generated by –heap-prof will be placed. The default value is controlled by the –diagnostic-dir command-line option.
- –heap-prof-name: Specify the file name of the heap profile generated by –heap-prof.
- –heap-prof-interval: Specify the average sampling interval in bytes for the heap profiles generated by –heap-prof. The default is 512 * 1024 bytes.
As an example:
node --heap-prof-dir "/home/LogFiles/" --heap-prof-name "mynew.heapprofile" --heap-prof server.js -
Download the *.heapprofile
You can use the new Kudu experience
https://mysite.scm.azurewebsites.net/newui/fileManagerand navigate through the folders. -
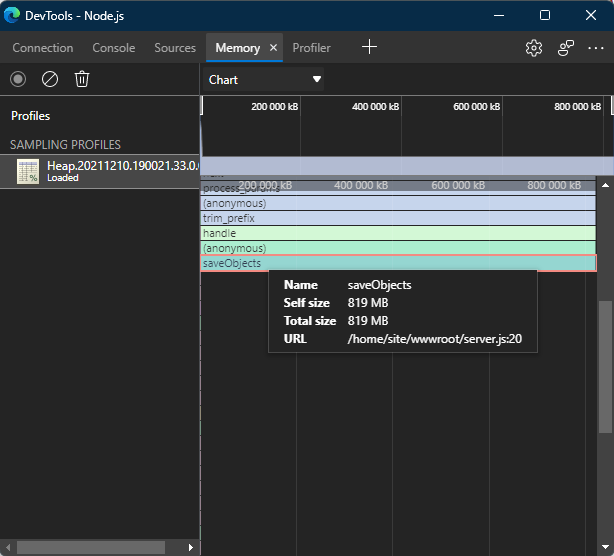
Analyze the .heapprofile
You can type in Chrome browser
chrome://inspect/or with Edgeedge://inspect, and then click onOpen dedicated DevTools for Node. Then selectMemorytab and load the*.heapprofilefile. And use different views as Chart, Heavy (Bottom up) or Tree.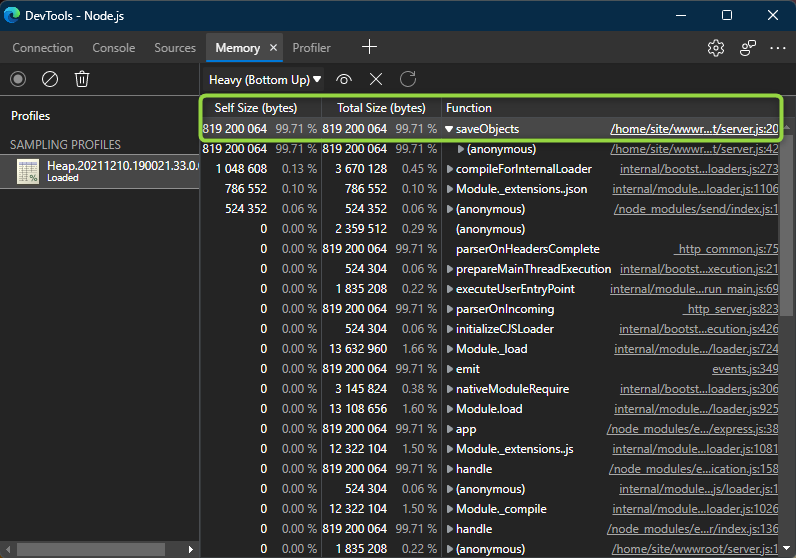
node –heapsnapshot-signal
Node.js V8 built-in profiler. Enables a signal handler that causes the Node.js process to write a heap dump when the specified signal is received. signal must be a valid signal name. Disabled by default.
Important: This flag was incorporated in Node.js >=12 versions.
To configure this profiler, you need the following steps:
-
Use Startup Command or Custom Startup Script
Update the startup command from Azure Portal -> Select your web app -> Click on Configuration -> Then General Settings -> Update the Startup Command textbox with:
node --heapsnapshot-signal=SIGUSR2 <entrypoint>.jsYou can use any signal for this scenario, we recommend to use the
user-definedsignals (SIGUSR1,SIGUSR2). -
Replicate the issue and stop the profiler
To stop the profiler you can SSH into the container and get the node.js process id with
ps auxw | grep nodeand then send the signal withkill -USR2 <pid>.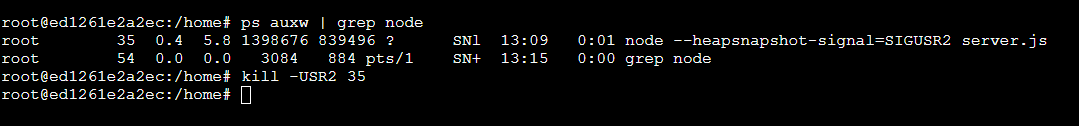
This will create *.heapsnapshot file.
-
Download the trace
Download this file from Kudu site using File Manager or vfs
https://<sitename>.scm.azurewebsites.net/api/vfs/site/wwwroot/. -
Analyze the .heapsnapshot file
You can type in Chrome browser
chrome://inspect/or with Edgeedge://inspect, and then click onOpen dedicated DevTools for Node. Then selectMemorytab and load the*.heapsnapshotfile. And use different views as Summary, Containment or Statistics.You will find several columns, the most important ones are
Shallow SizeandRetained Size.Shallow Size: This is the size of memory that is held by the object itself. Usually, only arrays and strings can have a significant shallow size.
Retained Size: This is the size of memory that is freed once the object itself is deleted due it becoming unreachable from GC roots. Held by object implicitly.
You will be looking for the highest percentage in
Retained Sizecomparing as well withShallow Size.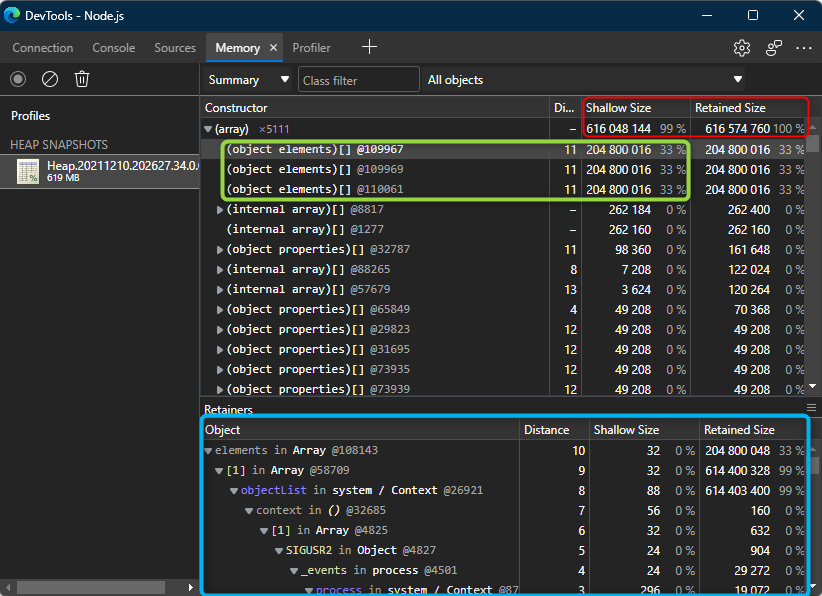
Node.js process and V8 API
The v8 module exposes APIs that are specific to the version of V8 built into the Node.js binary. Heap functions were added in Node.js v11.13.0 version.
Important: These modules are not considered as profilers but you can take heap snapshots and review for current heap size/spaces values.
v8.getHeapSnapshot()
Node.js API Documentation. Generates a snapshot of the current V8 heap and returns a Readable Stream that may be used to read the JSON serialized representation.
- Print heap snapshot to the console:
const v8 = require('v8'); const stream = v8.getHeapSnapshot(); stream.pipe(process.stdout); - Print heap snapshot to a file:
const v8 = require('v8');
const stream = v8.getHeapSnapshot();
const fileName = `${Date.now()}.heapsnapshot`;
const fileStream = fs.createWriteStream(fileName);
stream.pipe(fileStream);
v8 heap statistics
You can get statistics of the heap with the following methods:
-
v8.getHeapStatistics(). Returns a json object with the following properties:
{ "total_heap_size": 6758400, "total_heap_size_executable": 573440, "total_physical_size": 5343184, "total_available_size": 1850334072, "used_heap_size": 5053976, "heap_size_limit": 1854668800, "malloced_memory": 8192, "peak_malloced_memory": 586304, "does_zap_garbage": 0, "number_of_native_contexts": 1, "number_of_detached_contexts": 0 } -
v8.getHeapSpaceStatistics(). Returns statistics about the V8 heap spaces, i.e. the segments which make up the V8 heap.
[ { "space_name": "read_only_space", "space_size": 151552, "space_used_size": 150392, "space_available_size": 0, "physical_space_size": 150680 }, { "space_name": "new_space", "space_size": 1048576, "space_used_size": 110312, "space_available_size": 937112, "physical_space_size": 111464 }, { "space_name": "old_space", "space_size": 4087808, "space_used_size": 3964560, "space_available_size": 93944, "physical_space_size": 3973936 }, { "space_name": "code_space", "space_size": 360448, "space_used_size": 120192, "space_available_size": 5376, "physical_space_size": 141568 }, { "space_name": "map_space", "space_size": 528384, "space_used_size": 306000, "space_available_size": 216056, "physical_space_size": 497736 }, { "space_name": "large_object_space", "space_size": 532480, "space_used_size": 524344, "space_available_size": 0, "physical_space_size": 532480 }, { "space_name": "code_large_object_space", "space_size": 49152, "space_used_size": 2880, "space_available_size": 0, "physical_space_size": 49152 }, { "space_name": "new_large_object_space", "space_size": 0, "space_used_size": 0, "space_available_size": 1047424, "physical_space_size": 0 } ] -
process.memoryUsage(). Returns an object describing the memory usage of the Node.js process measured in bytes.
const memory= process.memoryUsage();
rss: Math.round(memory['rss'] / 1024 / 1024 * 100) / 100, //Resident set size (RSS) is the portion of memory occupied by a process that is held in main memory (RAM)
heapTotal:Math.round(memory['heapTotal'] / 1024 / 1024 * 100) / 100, //Total Size of the Heap
heapUsed:Math.round(memory['heapUsed'] / 1024 / 1024 * 100) / 100, //Heap actually Used
external:Math.round(memory['external'] / 1024 / 1024 * 100) / 100,

{
  "rss": "36.62 MB",
  "heapTotal": "6.45 MB",
  "heapUsed": "5.45 MB",
  "external": "1.39 MB",
  "memory_raw": {
    "rss": 38400000,
    "heapTotal": 6758400,
    "heapUsed": 5720176,
    "external": 1458382,
    "arrayBuffers": 26810
    }
}
Third-Party Profilers
You can find different third-party profilers available in npm repository. In this article we are going to cover just one of them.
The advantage of using third-party profilers is for you to take control and just take the heap snapshot at the time there is high memory defining an endpoint to do that. If you want to profile the entire application review Built-in profilers.
v8-profiler-node8
-
To install v8-profiler-node8 module, run the following command:
npm install v8-profiler-node8 -
To import the module, you can use the following code line:
var profiler = require('v8-profiler-node8'); -
You will need to start/stop the profiler in the application page or function that you think it is taking more Memory consumption.
If you want to save the profiler in a specific folder location, you will need
fslibrary:const fs = require('fs'); var snapshot = profiler.takeSnapshot(id); snapshot.export().pipe(fs.createWriteStream(__dirname + '/profiles/' + id + '.heapsnapshot'));Note: It is important to keep always .heapsnapshot extension.
-
To analyze this profile you can type in Chrome browser
chrome://inspect/or with Edgeedge://inspect, and then click onOpen dedicated DevTools for Node. Then selectMemorytab and load the*.heapsnapshotfile. And use different views as Summary, Containment or Statistics.
heapdump
Make a dump of the V8 heap for later inspection.
-
To install heapdump module, run the following command:
npm install heapdump -
To import the module, you can use the following code line:
var heapdump = require('heapdump'); -
To configure and take a heap snapshot:
     heapdump.writeSnapshot((err, filename) => {
       console.log("Heap dump written to", filename);
     });
-
For troubleshooting High CPU scenarios in Azure App Service Linux follow the next reference.
-
For troubleshooting High Memory/CPU in Azure App Service Windows follow the next references:


