Container Apps - General troubleshooting with Dapr on Container Apps
This post will cover some common scenarios that may occur when using Dapr on Container Apps. This mostly focuses on general troubleshooting, Service Invocation, and the State Management/Pubsub components
Overview
Container Apps offers built-in support for Dapr. This post will cover some more generalized and common scenarios as well as talking about some component troubleshooting.
Although this may be at a high-level, this can potentially be used to point yourself in the right direction for troubleshooting.
Limitations
Limitations on Dapr with Container Apps is called out here - Dapr integration with Azure Container Apps - Limitations
Additionally, with the following:
- For pubsub, declarative subscriptions can’t be used - only programmatic.
- Only one Dapr sidecar runs in a pod/replica
- The exposed HTTP API port for Dapr through the sidecar is always 3500 - gRPC is 50001. This cannot be changed.
How to check the current Dapr version
Under the Overview blade for the Container App Environment, there is a property that shows the current Dapr version
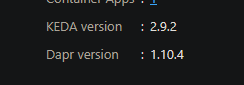
This may be helpful is needing to know the current version in the environment.
General troubleshooting
- It is a good idea to validate if a application utilizing Dapr works locally, which can be done through a local Kubernetes instance or in self-hosted mode. See install the Dapr CLI. If it turns out to be an issue with a specific Dapr version, or local component issues, reviewing Dapr docs or asking a question in the Dapr Discord channel or a GitHub issue is ideal.
- Depending on your Logging Option (set in the Container App Environment), Log Analytics (
ContainerAppConsoleLogs_CL) or Azure Monitor (ContainerAppConsoleLogs) will contain stdout/err for thedaprdsidecar that’s a part of your pod/replica. The Dapr API verbosity option (seen below) also influences the kind of logs seen here.
Knowing this is incredibly important for overall troubleshooting with Dapr. The output here is the same kind of output you’d see from daprd when running locally.
time="2024-02-12T17:14:21.77245614Z" level=info msg="starting Dapr Runtime -- version 1.11.6 -- commit 349d21adeac3425919e0fea8cb58c4a2ec799a3f" app_id=go-pubsub instance=someapp--qqeuvcc-7fbff77449-trzbx scope=dapr.runtime type=log ver=1.11.6
time="2024-02-12T17:14:21.772518438Z" level=info msg="log level set to: debug" app_id=go-pubsub instance=someapp--qqeuvcc-7fbff77449-trzbx scope=dapr.runtime type=log ver=1.11.6
time="2024-02-12T17:14:21.772632589Z" level=info msg="metrics server started on :9090/" app_id=go-pubsub instance=someapp--qqeuvcc-7fbff77449-trzbx scope=dapr.metrics type=log ver=1.11.6
time="2024-02-12T17:14:21.772743081Z" level=info msg="Initializing the operator client" app_id=go-pubsub instance=someapp--qqeuvcc-7fbff77449-trzbx scope=dapr.runtime type=log ver=1.11.6
time="2024-02-12T17:14:21.781894439Z" level=debug msg="Loading Kubernetes config resource: defaultconfig" app_id=go-pubsub instance=someapp--qqeuvcc-7fbff77449-trzbx scope=dapr.runtime type=log ver=1.11.6
time="2024-02-12T17:14:21.785143677Z" level=debug msg="No resiliency policies found" app_id=go-pubsub instance=someapp--qqeuvcc-7fbff77449-trzbx scope=dapr.runtime type=log ver=1.11.6
time="2024-02-12T17:14:21.785169708Z" level=debug msg="Found 0 resiliency configurations from Kubernetes" app_id=go-pubsub instance=someapp--qqeuvcc-7fbff77449-trzbx scope=dapr.runtime type=log ver=1.11.6
time="2024-02-12T17:14:21.785195051Z" level=info msg="Resiliency configuration loaded" app_id=go-pubsub instance=someapp--qqeuvcc-7fbff77449-trzbx scope=dapr.runtime type=log ver=1.11.6
time="2024-02-12T17:14:21.78520075Z" level=debug msg="No Access control policy specified" app_id=go-pubsub instance=someapp--qqeuvcc-7fbff77449-trzbx scope=dapr.acl type=log ver=1.11.6
time="2024-02-12T17:14:21.786006664Z" level=info msg="kubernetes mode configured" app_id=go-pubsub instance=someapp--qqeuvcc-7fbff77449-trzbx scope=dapr.runtime type=log ver=1.11.6
time="2024-02-12T17:14:21.786033443Z" level=info msg="app id: go-pubsub" app_id=go-pubsub instance=someapp--qqeuvcc-7fbff77449-trzbx scope=dapr.runtime type=log ver=1.11.6
time="2024-02-12T17:14:21.786054759Z" level=info msg="mTLS enabled. creating sidecar authenticator" app_id=go-pubsub instance=someapp--qqeuvcc-7fbff77449-trzbx scope=dapr.runtime type=log ver=1.11.6
time="2024-02-12T17:14:21.786169121Z" level=info msg="trust anchors and cert chain extracted successfully" app_id=go-pubsub instance=someapp--qqeuvcc-7fbff77449-trzbx scope=dapr.runtime.security type=log ver=1.11.6
time="2024-02-12T17:14:21.786185935Z" level=info msg="authenticator created" app_id=go-pubsub instance=someapp--qqeuvcc-7fbff77449-trzbx scope=dapr.runtime type=log ver=1.11.6
time="2024-02-12T17:14:21.796812226Z" level=info msg="Dapr trace sampler initialized: DaprTraceSampler(P=1.000000)" app_id=go-pubsub instance=someapp--qqeuvcc-7fbff77449-trzbx scope=dapr.runtime type=log ver=1.11.6
time="2024-02-12T17:14:21.797348731Z" level=info msg="Initialized name resolution to k8se" app_id=go-pubsub instance=someapp--qqeuvcc-7fbff77449-trzbx scope=dapr.runtime type=log ver=1.11.6
time="2024-02-12T17:14:21.797448745Z" level=info msg="Loading components…" app_id=go-pubsub instance=someapp--qqeuvcc-7fbff77449-trzbx scope=dapr.runtime type=log ver=1.11.6
time="2024-02-12T17:14:21.799537865Z" level=debug msg="Found component: pubsub (pubsub.azure.eventhubs/v1)" app_id=go-pubsub instance=someapp--qqeuvcc-7fbff77449-trzbx scope=dapr.runtime type=log ver=1.11.6
time="2024-02-12T17:14:21.799665593Z" level=info msg="Waiting for all outstanding components to be processed" app_id=go-pubsub instance=someapp--qqeuvcc-7fbff77449-trzbx scope=dapr.runtime type=log ver=1.11.6
time="2024-02-12T17:14:21.799678331Z" level=debug msg="Loading component: pubsub (pubsub.azure.eventhubs/v1)" app_id=go-pubsub instance=someapp--qqeuvcc-7fbff77449-trzbx scope=dapr.runtime type=log ver=1.11.6
time="2024-02-12T17:14:21.799979923Z" level=info msg="The provided connection string is specific to the Event Hub (\"entity path\") 'orders'; publishing or subscribing to a topic that does not match this Event Hub will fail when attempted" app_id=go-pubsub component="pubsub (pubsub.azure.eventhubs/v1)" instance=someapp--qqeuvcc-7fbff77449-trzbx scope=dapr.contrib type=log ver=1.11.6
time="2024-02-12T17:14:21.800073504Z" level=info msg="Component loaded: pubsub (pubsub.azure.eventhubs/v1)" app_id=go-pubsub instance=someapp--qqeuvcc-7fbff77449-trzbx scope=dapr.runtime type=log ver=1.11.6
time="2024-02-12T17:14:21.800092843Z" level=info msg="All outstanding components processed" app_id=go-pubsub instance=someapp--qqeuvcc-7fbff77449-trzbx scope=dapr.runtime type=log ver=1.11.6
time="2024-02-12T17:14:21.800106043Z" level=info msg="Loading endpoints" app_id=go-pubsub instance=someapp--qqeuvcc-7fbff77449-trzbx scope=dapr.runtime type=log ver=1.11.6
time="2024-02-12T17:14:21.80163449Z" level=debug msg="No http endpoints found" app_id=go-pubsub instance=someapp--qqeuvcc-7fbff77449-trzbx scope=dapr.runtime.httpendpoints type=log ver=1.11.6
time="2024-02-12T17:14:21.801936125Z" level=info msg="Waiting for all outstanding http endpoints to be processed" app_id=go-pubsub instance=someapp--qqeuvcc-7fbff77449-trzbx scope=dapr.runtime type=log ver=1.11.6
time="2024-02-12T17:14:21.802070319Z" level=info msg="All outstanding http endpoints processed" app_id=go-pubsub instance=someapp--qqeuvcc-7fbff77449-trzbx scope=dapr.runtime type=log ver=1.11.6
time="2024-02-12T17:14:21.802508458Z" level=info msg="gRPC proxy enabled" app_id=go-pubsub instance=someapp--qqeuvcc-7fbff77449-trzbx scope=dapr.runtime type=log ver=1.11.6
time="2024-02-12T17:14:21.802801319Z" level=info msg="gRPC server listening on TCP address: [::1]:50001" app_id=go-pubsub instance=someapp--qqeuvcc-7fbff77449-trzbx scope=dapr.runtime.grpc.api type=log ver=1.11.6
time="2024-02-12T17:14:21.803162606Z" level=info msg="gRPC server listening on TCP address: 127.0.0.1:50001" app_id=go-pubsub instance=someapp--qqeuvcc-7fbff77449-trzbx scope=dapr.runtime.grpc.api type=log ver=1.11.6
time="2024-02-12T17:14:21.962326119Z" level=info msg="application discovered on port 3000" app_id=go-pubsub instance=someapp--qqeuvcc-7fbff77449-trzbx scope=dapr.runtime type=log ver=1.11.6
Looking through the various output above, we can see this shows a lot of events - such as the version of Dapr being used, various configuration loaded (by default), Dapr components that are loaded (if any), application discovery, and others.
If a component fails to load, there should be at least one log with a level of fatal, and potentially a log with a level of warning, with a reason for the issue. If the replicas of the Container App scale down to zero, the Dapr sidecar will automatically shutdown and messages that resemble the following should appear, which is generally normal. However, if an Actor on the Container App, minReplicas set to at least one to avoid this behavior so that the Actor can function. This is called out in the limitations hyperlink above.
The below logging will also show for any new pod or replicas being created. Especially in “restart” scenarios - if you carefully look at the pod/replica name (exposed through the ContainerGroupName_s column in ContainerAppConsoleLogs) - you’ll see this follows the logic in Container Apps - Demystifying restarts. The daprd sidecar in the “old” pod/replica will shutdown while the new one starts up
time="2024-02-12T17:14:29.340921459Z" level=info msg="Dapr shutting down" app_id=go-pubsub instance=someapp--qqeuvcc-845886bbff-bld5n scope=dapr.runtime type=log ver=1.11.6
time="2024-02-12T17:14:29.340993239Z" level=info msg="Stopping PubSub subscribers and input bindings" app_id=go-pubsub instance=someapp--qqeuvcc-845886bbff-bld5n scope=dapr.runtime type=log ver=1.11.6
time="2024-02-12T17:14:29.341010362Z" level=info msg="Shutting down workflow engine" app_id=go-pubsub instance=someapp--qqeuvcc-845886bbff-bld5n scope=dapr.runtime type=log ver=1.11.6
time="2024-02-12T17:14:29.341018735Z" level=info msg="Initiating actor shutdown" app_id=go-pubsub instance=someapp--qqeuvcc-845886bbff-bld5n scope=dapr.runtime type=log ver=1.11.6
time="2024-02-12T17:14:29.341026503Z" level=info msg="Shutting down actor" app_id=go-pubsub instance=someapp--qqeuvcc-845886bbff-bld5n scope=dapr.runtime type=log ver=1.11.6
time="2024-02-12T17:14:29.341039199Z" level=info msg="Holding shutdown for 5s to allow graceful stop of outstanding operations" app_id=go-pubsub instance=someapp--qqeuvcc-845886bbff-bld5n scope=dapr.runtime type=log ver=1.11.6
time="2024-02-12T17:14:34.341514242Z" level=info msg="Stopping Dapr APIs" app_id=go-pubsub instance=someapp--qqeuvcc-845886bbff-bld5n scope=dapr.runtime type=log ver=1.11.6
time="2024-02-12T17:14:34.341869812Z" level=info msg="Shutting down all remaining components" app_id=go-pubsub instance=someapp--qqeuvcc-845886bbff-bld5n scope=dapr.runtime type=log ver=1.11.6
gRPC and HTTP protocols
Ensure if the application is using HTTP or gRPC that the protocol is appropriately set for daprd in the Dapr blade on the application:
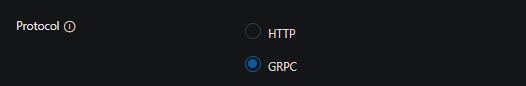
For example, in this case, this Dapr SDK for Go was expecting to communicate over gRPC - but the protocol was set to HTTP. Therefor the below connection refused occurred since the HTTP port of 3500 is expecting to be accessed. More than likely, these kind of events are only going to surface in an application containers ContainerAppConsoleLogs / ContainerAppConsoleLogs_CL and not within daprd - the below would be found in ContainerAppConsoleLogs:
panic: error publishing event unto orders topic: rpc error: code = Unavailable desc = connection error: desc = "transport: Error while dialing: dial tcp 127.0.0.1:50001: connect: connection refused"
By default, the protocol is HTTP after enabling Dapr on an application.
Logging that may be ‘noise’
This section is to call out certain messages that may be present in ContainerAppConsoleLogs / ContainerAppConsoleLogs_CL when daprd is enabled for a Container App.
- If an application is not configured to use Actors - then this should be ignored. This will appear on startup of
daprdand is just a “call out”
level=info msg="actors: state store is not configured - this is okay for clients but services with hosted actors will fail to initialize!"
- This is more than likely always noise and typically non-fatal - especially if there is just one message on startup about this. As the message indicates, the placement service call is reattempted in the background. This will show on the startup of
daprdand should have no availability affects on the application.
level=debug msg="error connecting to placement service (will retry to connect in background): rpc error: code = Unavailable desc = last resolver error: produced zero addresses"
Dapr API error codes
A full list of Dapr API error codes can be found here. What is returned will depend on the component used (if any) and the scenario.
It is good to cross-reference these messages to the table in the above link. Even if an application is not set to return the direct error from Dapr, logging through ContainerAppConsoleLogs and filtering on the daprd can possibly
Component troubleshooting
State Management troubleshooting
State Management refers to the “State Management” Dapr API that can be used with an HTTP client (various based on language) as well as the Dapr SDK, which also varies based on language. Documentation on the State Management API can be found here.
- State stores that can be used can be found here
- Dapr SDKs that can be used with State Management can be found here
The base URL for the State Store through the HTTP API is http://localhost:3500/v1.0/state/[your_statestore_name]. Under the hood, the SDK will use a base host and port defined in the language SDK code base.
Paths for different CRUD operations regarding state will vary depending on what is being tried - here. The biggest difference is that the HTTP VERB associated with these operations need to change too. Eg.
- Get State:
GET - Delete State:
DELETE - Create State:
POST - etc.
When the State Management HTTP API is invoked, you’ll see daprd sidecar logging about this - the method will depend on what kind of HTTP VERB the client application making the API call is using:
level=info msg="HTTP API Called" app_id=python-app instance=someapp--gy2u6mk-6b48968d5f-mdwsj method="POST /v1.0/state/{storeName}" scope=dapr.runtime.http-info type=log useragent=python-requests/2.28.1 ver=1.11.6
Or it may look like the below, if an SDK is used (the log itself will vary depending on the language used) - which also happens to use gRPC for the pubsub operations
level=info msg="gRPC API Called" app_id=python-app instance=some-app--fk72mzz-6887f49b67-8zxkq method=/dapr.proto.runtime.v1.Dapr/SaveState scope=dapr.runtime.grpc.api-info type=log useragent="dapr-sdk-python/1.12.1 grpc-python/1.60.1 grpc-c/37.0.0 (linux; chttp2)" ver=1.11.6
For general component metaData issues - where metaData has incorrect information, eg., an incorrect Storage Account, you may get something like the below in which the component fails to load:
level=fatal msg="process component statestore error: [INIT_COMPONENT_FAILURE]: initialization error occurred for statestore (state.azure.blobstorage/v1): init timeout for component statestore exceeded after 5s" app_id=go-app instance=someapp--e4n7wj3-658dd7d969-6twrz scope=dapr.runtime type=log ver=1.11.6
State Management message codes
ERR_STATE_STORES_NOT_CONFIGURED:
The equivalent of this may look like the below in daprd:
time="2024-02-08T22:08:47.649371144Z" level=debug msg="api error: code = FailedPrecondition desc = state store is not configured" app_id=python-app instance=some-appp--8gyw3on-7bb477d6d7-dbzpt scope=dapr.runtime.http type=log ver=1.11.6
If Dapr is enabled, but the State Store API is being called through an HTTP client or the Dapr SDK, but no State Store was configured (either never added or for some reason never loaded through Dapr), this error will occur.
If a State Store was added at some later point in time, ensure the Container App is restarted so the new/pod replicas will have daprd load the component in.
You can ensure that a State Store component was created by looking at the Dapr components blade on the Container App Environment. In ContainerAppConsoleLogs / ContainerAppConsoleLogs_CL, you can confirm if the state store component was loaded or not by carefully reviewing messaging - below is the typical messages you’d want to see for any Dapr component:
Ideally, we want to see the below - which would confirm the component is loaded. If we don’t see these logs at all upon daprd startup, then we can infer the Store Store was not loaded which would put us into this problem. Note, that during normal runtime you should not see this under the daprd sidecar was restarted, or, a new pod or replica was created:
time="2024-02-08T22:21:17.508900433Z" level=info msg="Loading components…" app_id=python-app instance=some-app--8gyw3on-56c84b68d7-vg4nb scope=dapr.runtime type=log ver=1.11.6
time="2024-02-08T22:21:17.510808895Z" level=debug msg="Found component: statestore (state.azure.blobstorage/v1)" app_id=python-app instance=some-app--8gyw3on-56c84b68d7-vg4nb scope=dapr.runtime type=log ver=1.11.6
time="2024-02-08T22:21:17.510842467Z" level=info msg="Waiting for all outstanding components to be processed" app_id=python-app instance=some-app--8gyw3on-56c84b68d7-vg4nb scope=dapr.runtime type=log ver=1.11.6
time="2024-02-08T22:21:17.510860302Z" level=debug msg="Loading component: statestore (state.azure.blobstorage/v1)" app_id=python-app instance=some-app--8gyw3on-56c84b68d7-vg4nb scope=dapr.runtime type=log ver=1.11.6
time="2024-02-08T22:21:17.575072929Z" level=info msg="Component loaded: statestore (state.azure.blobstorage/v1)" app_id=python-app instance=some-app--8gyw3on-56c84b68d7-vg4nb scope=dapr.runtime type=log ver=1.11.6
time="2024-02-08T22:21:17.575121312Z" level=info msg="All outstanding components processed" app_id=python-app instance=some-app--8gyw3on-56c84b68d7-vg4nb scope=dapr.runtime type=log ver=1.11.6
The state store type will completely depend on the component and which backing store is used.
Depending on how the application is written, the call to state may very much return an HTTP 200, but ultimately state will not be altered or retrieved if the component is never loaded.
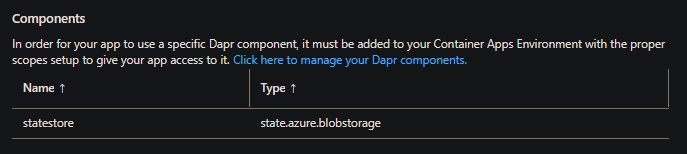
ERR_STATE_STORE_NOT_FOUND:
This means that the Store Store component is loaded - but the state store specified by the application does not exist, may be mispelled, or scoped to the wrong component.
Quick validation that can be done is to go into the Dapr blade for the application and review the name of the State Store to see if this matches what the application is referencing - this is assuming the component is scoped to the application (and the correct one):
Else, if it not scoped, which all applications will have it loaded, go to the Dapr Components blade on the Container App Environment:
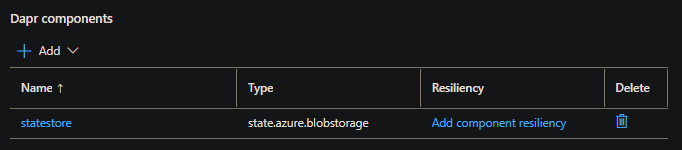
Using an example below, we’d be able to confirm the state store was loaded:
level=info msg="Loading components…" app_id=python-app instance=some-app--8gyw3on-56c84b68d7-vg4nb scope=dapr.runtime type=log ver=1.11.6
level=debug msg="Found component: statestore (state.azure.blobstorage/v1)" app_id=python-app instance=some-app--8gyw3on-56c84b68d7-vg4nb scope=dapr.runtime type=log ver=1.11.6
level=info msg="Waiting for all outstanding components to be processed" app_id=python-app instance=some-app--8gyw3on-56c84b68d7-vg4nb scope=dapr.runtime type=log ver=1.11.6
level=debug msg="Loading component: statestore (state.azure.blobstorage/v1)" app_id=python-app instance=some-app--8gyw3on-56c84b68d7-vg4nb scope=dapr.runtime type=log ver=1.11.6
level=info msg="Component loaded: statestore (state.azure.blobstorage/v1)" app_id=python-app instance=some-app--8gyw3on-56c84b68d7-vg4nb scope=dapr.runtime type=log ver=1.11.6
level=info msg="All outstanding components processed" app_id=python-app instance=some-app--8gyw3on-56c84b68d7-vg4nb scope=dapr.runtime type=log ver=1.11.6
But when looking in ContainerAppConsoleLogs_CL, we’d see the below message:
level=debug msg="api error: code = InvalidArgument desc = state store statestores is not found" app_id=python-app instance=someapp--gy2u6mk-6778d7478d-wgvc9 scope=dapr.runtime.http type=log ver=1.11.6
Where “statestores” is the name of the State Store being referenced within the calling application code. In this example, we can see that the client application is calling the wrong store name - however, this can happen for all the reasons mentioned earlier above.
Service Invocation troubleshooting
Service Invocation refers to the “Service Invocation” Dapr API that can be used with an HTTP client (various based on language), Dapr SDK or gRPC - which also varies based on language. Documentation on the Service Invocation API can be found here.
- Dapr SDKs that can be used with Service Invocation can be found here
An example of “Service Invocation” is a client using the Dapr API to call to other services, like a backend API. This is done within the application through the following:
- HTTP API:
http://localhost:3500/v1.0/invoke/some_service/method/some_backend_route- This can be broken down into the following:
http://localhost:3500/v1.0/invoke- This is the “base URL”. This always remains the same.backend- This needs to match the name of the Dapr App ID of the target resource being called upstream. “some_service” is just an example.method- This needs to remain in the URL scheme above. Just like the “base URL”some_backend_route- This is the route/path being called on the target service. For instance,http://localhost:3500/v1.0/invoke/backend/method/controllerRouteor - if it was a nested path, an example would behttp://localhost:3500/v1.0/invoke/backend/method/api/controllerRoute
- gRPC:
- The synax may vary based on language, but the concept remains the same, where you target
localhost:50001while specifying theAppIdin the request - See How-To: Invoke services using gRPC
- The synax may vary based on language, but the concept remains the same, where you target
Note, using the SDK with the Service Invocation method will vary based on the language - but you still need to target the correct App Id of the upstream resource.
You do not need any components for Service Invocation. Only Dapr needs to be enabled at the application level to use this API.
Service invocation message codes
ERR_DIRECT_INVOKE:
A full error message may look like:
{"errorCode":"ERR_DIRECT_INVOKE","message":"fail to invoke, id: backen, err: rpc error: code = Unimplemented desc = "}#
This is likely due to the target method not matching the Dapr App Id of the upstream resource. For example:
- HTTP:
http://localhost:3500/v1.0/invoke/backend/method/controllerRoute- If “backend” is not an existing Dapr App Id of an upstream resource, this will causeERR_DIRECT_INVOKE - SDK: This varies on the language, but typically you’d pass the Dapr App Id of the target resource as a string into the
invokemethod exposed from the SDK - gRPC (client, non-SDK): Just like the first two points - ensure the Dapr App Id of the upstream resource is correct. This will depend on the language used, for example with Go and a gRPC client -
ctx = metadata.AppendToOutgoingContext(ctx, "dapr-app-id", "backend")
From ContainerAppConsoleLogs, you can query output from daprd to see when the invoke API is called for Service Invocation:
ContainerAppConsoleLogs_CL
| where ContainerName_s == "daprd"
| project TimeGenerated, Log_s, ContainerAppName_s, ContainerGroupName_s
(HTTP API)
level=info msg="HTTP API Called" app_id=frontend instance=some-app--yo0h472-79b654fc48-57ncr method="GET /v1.0/invoke/{id}/method/{method:*}" scope=dapr.runtime.http-info type=log useragent=python-requests/2.28.1 ver=1.11.6
(gRPC API)
time="2024-02-12T20:30:53.106095734Z" level=info msg="gRPC API Called" app_id=client instance=someapp--7hwmpzf-569599f95c-sngdk method=/helloworld.Greeter/SayHello scope=dapr.runtime.grpc.api-info type=log useragent=grpc-go/1.61.0 ver=1.11.6
NOTE: User-Agent completely depends on the application and what kind of HTTP client is being used. Even with Dapr SDK usage, the User-Agent may vary since different HTTP clients are used under the hood
For additional testing, you can connect to the application container through Console and use curl to test the upstream resource:
curl -v http://localhost:3500/v1.0/invoke/myupstreamservice/method/myendpoint
Pubsub troubleshooting
Pubsub refers to the “publish and subscribe” methods and Dapr API’s - the full API reference for the Dapr pubsub API can be found here.
The pubsub building block documentation along with other links to quickstarts and tutorials can be found here.
As a reference, when a pubsub API is invoked, it’ll show the following through daprd:
-
The below shows what it may look like when a pubsub gRPC API is called (the User-Agent will vary based on the SDK used):
level=info msg="gRPC API Called" app_id=go-app instance=someapp--yrdy-59b746866f-fbzkb method=/dapr.proto.runtime.v1.Dapr/PublishEvent scope=dapr.runtime.grpc.api-info type=log useragent="dapr-sdk-go/v1.9.1 grpc-go/1.57.0" ver=1.11.6 -
The below is through the HTTP API (the User-Agent will vary based on the HTTP client used):
time="2023-10-18T21:24:19.343194954Z" level=info msg="HTTP API Called" app_id=node-app instance=dapr-pub-sub-examples-node-http--d4np7jq-684c774bb8-ngwl6 method="POST /v1.0/publish/{pubsubname}/{topic:*}" scope=dapr.runtime.http-info type=log useragent=axios/1.5.1 ver=1.11.2-msft-3
Pubsub status codes
The Dapr pubsub API has a set of status codes that may be returned in certain scenarios. This may manifest in application logging:
Code |	Description
204 |	Message delivered
403 |	Message forbidden by access controls
404 |	No pubsub name or topic given
500 |	Delivery failed
You can view the API documentation here
Pubsub message codes
Pubsub “message” codes refer to the text message returned in the response body. This is returned from daprd as seen in the codebase here - GitHub - dapr - api.go
NOTE: These error messages will appear in the ContainerAppConsoleLog_CL / ContainerAppConsoleLog tables - this may be returned from the application response - or - an related message seen from daprd
ERR_PUBSUB_PUBLISH_MESSAGE:
This may be a generic message, review the message in the returned body for more details. This may likely point to the reason for this message.
An example of this is:
message: "error when publish to topic sometopic in pubsub somepubsub: error trying to establish a connection: the requested topic 'sometopic' does not match the Event Hub name in the connection string"
Or the below - which indicates the FQDN in the connection string is incorrect, or, DNS cannot be resolved to the FQDN of the pubsub (eventhub, in this case)
message: 'error when publish to topic asome-topic in pubsub some-pubsub: error creating event batch: (connlost): dial tcp: lookup some-eventhub.servicebus.windows.net on 10.96.0.10:53: no such host'
ERR_PUBSUB_NOT_FOUND:
The pubsub name may be incorrect or does not exist.
Review the connection string (if used) in the component metadata. Since programmatic subscriptions can only be used (as called out in the limits and caveats section above, declarative component subscriptions is not supported), review the calling client within your code to make sure they’re not calling an incorrect or non-existent pubsub name - which will depend on how the endpoint is contructed (eg., through an HTTP client or SDK usage).
An example response body of this is:
data: {
  errorCode: 'ERR_PUBSUB_NOT_FOUND',
  message: 'pubsub eventhubs-pubsubt not found'
}
ERR_PUBSUB_NOT_CONFIGURED:
The application may not be appropriately scoped to the pubsub component - or there is no existing pubsub component. If a component was added but the application was never restarted (new deployment, revision, etc.) then this change would not have been picked up.
You’d want to review ContainerAppConsoleLogs_CL ContainerAppConsoleLogs to ensure there is a message about the pubsub component being loaded like below - if this is not shown, then this is likely a contributor or root cause to the problem:
time="2024-02-12T17:14:21.797448745Z" level=info msg="Loading components…" app_id=go-pubsub instance=someapp--qqeuvcc-7fbff77449-trzbx scope=dapr.runtime type=log ver=1.11.6
time="2024-02-12T17:14:21.799537865Z" level=debug msg="Found component: pubsub (pubsub.azure.eventhubs/v1)" app_id=go-pubsub instance=someapp--qqeuvcc-7fbff77449-trzbx scope=dapr.runtime type=log ver=1.11.6
time="2024-02-12T17:14:21.799665593Z" level=info msg="Waiting for all outstanding components to be processed" app_id=go-pubsub instance=someapp--qqeuvcc-7fbff77449-trzbx scope=dapr.runtime type=log ver=1.11.6
time="2024-02-12T17:14:21.799678331Z" level=debug msg="Loading component: pubsub (pubsub.azure.eventhubs/v1)" app_id=go-pubsub instance=someapp--qqeuvcc-7fbff77449-trzbx scope=dapr.runtime type=log ver=1.11.6
time="2024-02-12T17:14:21.799979923Z" level=info msg="The provided connection string is specific to the Event Hub (\"entity path\") 'orders'; publishing or subscribing to a topic that does not match this Event Hub will fail when attempted" app_id=go-pubsub component="pubsub (pubsub.azure.eventhubs/v1)" instance=someapp--qqeuvcc-7fbff77449-trzbx scope=dapr.contrib type=log ver=1.11.6
time="2024-02-12T17:14:21.800073504Z" level=info msg="Component loaded: pubsub (pubsub.azure.eventhubs/v1)" app_id=go-pubsub instance=someapp--qqeuvcc-7fbff77449-trzbx scope=dapr.runtime type=log ver=1.11.6
time="2024-02-12T17:14:21.800092843Z" level=info msg="All outstanding components processed" app_id=go-pubsub instance=someapp--qqeuvcc-7fbff77449-trzbx scope=dapr.runtime type=log ver=1.11.6
NOTE: There can be various pubsub providers, this is just an example using Event Hub, but the messages will look almost the same regardless of provider
This may also happen if the appId is renamed while the old appId is shown as “not found” on the component. Ensure the appId and scope is updated and then the revision is restarted.
Below is an example message:
{
    errorCode: 'ERR_PUBSUB_NOT_CONFIGURED',
    message: 'no pubsub is configured'
}
In daprd logging within console logs, this may show the following message - note, this may vary slightly based on whether an SDK or HTTP API is being used as well as gRPC:
level=debug msg="rpc error: code = FailedPrecondition desc = no pubsub is configured" app_id=go-pubsub instance=some-pubsub--cgfkfw9-9fc65ddf5-czfnx scope=dapr.runtime.grpc.api type=log ver=1.11.6
Unable to publish
Unable to publish would mean that a client application is unable to send messages to the target resource - eg., Event Hub, Service Bus, or other message-based service. This is in addition to the specific errors mentioned above.
Scoping:
- Confirm the error message. Is this appearing in application container logs, or in
daprd(sidecar) stdout/err? Or both? - Review the details of the type of pubsub component that is being used - including the target message resource and the
metaDatafields. For new implementations:- A list of supported components for message brokers can be found here - Dapr - Components - Pubsub
- You can click on a specific component to view the supported
metaDatafields and cross-reference these, if needed
Potential common issues:
- The Container App does not have access to the message resource, such as:
- Blocked by networking, unable to resolve the FQDN - or RBAC roles set and the client does not have access
- The component is setting scope to an incorrect App Id
- The pubsub
metaDatais targeting an incorrect or non-existent message server. Either by FQDN or by topic name. Additionally, connectionStrings, if used, may be incorrect. - Missing or misconfigured required
metaData- cross reference requirements for a component here - Dapr - Components - Pubsub
Unable to subscribe
Since programmatic subscriptions can be only be used - see the documentation here - Dapr - Programmatic Subscriptions.
- Depending on the application and how it is writing out
stdout- a successful call for Dapr subscriptions would be logged out in an applications HTTP access log (or elsewhere if they’re redirectingstdoutto a specific location). This would look something like2023-10-23T21:07:37.445738298Z 127.0.0.1 - - [23/Oct/2023:21:07:37 +0000] "GET /dapr/subscribe HTTP/1.1" 200 60 "-" "Go-http-client/1.1". - A
GETrequest to/dapr/subscribeis made from Dapr to the applications endpoint that is exposing the path/dapr/subscribe- if the application is wanting to subscribe - a successful call would return an HTTP 200
Component metaData should be reviewed. As an example, with Event Hub, if consumerID is not set to the Consumer Group created on the Event Hub side, then subscription endpoints may not receive data, even though there may be no error.
This may vary based on which message broker is being used (not all components use the same metaData properties).
In certain cases, an application may not be able to subscribe if they’re not aware of the “Consumer groups and competing patterns”
- In the competing consumers pattern, multiple application instances using a single consumer group compete for the message. Dapr enforces the competing consumer pattern when replicas use the same app-id without explicit consumer group overrides. When multiple instances of the same application (with same app-id) subscribe to a topic, Dapr delivers each message to only one instance of that application.
An example of this could be if one is running an application locally, and then runs the same application on Container Apps - both running at the same time - which means there is now two subscribers - then potentially only the local application will receive events as it was running first.
Other status messages
ERR_HEALTH_NOT_READY dapr is not ready:
This will look like the following in console logs:
level=debug msg="{ERR_HEALTH_NOT_READY dapr is not ready}" app_id=go-app instance=someapp-http--yrdy-7c97f56697-bllgh scope=dapr.runtime.http type=log ver=1.11.6
This can occur if a component has incorrect metaData - eg., wrong Access Key, or any other property that has wrong values where it needs to connect to an external resource. An issue can be inferred when this is repeatedly being seen in daprs sidecar logs in either table.
delayed connect error: 111:
The full message would be upstream connect error or disconnect/reset before headers. retried and the latest reset reason: remote connection failure, transport failure reason: delayed connect error: 111 returned to a client. This may immediately show after invoking a request.
This is not Dapr specific - rather, this is returned from Envoy and is an HTTP 503 - which is due to the application container exiting due to a fatal error or unhandled exception. The reason this is mentioned in this Dapr blog is due to the chance, which completely depends on the application, where a component or service is invoked and fails - and when happens, encounters this scenario.
On top of this, there is a likely chance that in some situations an associated error is not written to stderr by daprd, thus not appearing in ContainerAppConsoleLogs / ContainerAppConsoleLogs when filtering by the daprd container name.
Instead, it’s very important to look in ContainerAppConsoleLogs / ContainerAppConsoleLogs (for the application container) to try and find the fatal error or exception. Below is an example of a fatal error (due to log.Fatalf, which implicitly calls exit) with Go due to calling an invalid upstream App Id:
2024/02/12 20:59:46 could not greet: rpc error: code = Unimplemented desc =
Or this panic, due to no configured pubsub component:
panic: error publishing event unto orders topic: rpc error: code = FailedPrecondition desc = no pubsub is configured
Ultimately, the error, and how it’s handled, will dictate the logging you see.
Dapr API logging
You can set log verbosity for Dapr via the portal - under the “Dapr” blade on the Container App. The output here mimics what would be shown running Dapr anywhere else, such as locally.
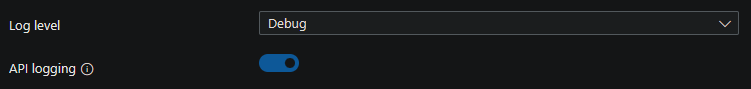
Setting the log level to Debug can be helpful in troubleshooting issues. This will show more detailed logging around various Dapr lifecycle events. For instance, using the Pubsub component and Event Hub as an example - when setting logging to Debug - we can see more specific events logged out. This would be useful in cases where an app wasn’t receiving messages after subscribing to a message service:
The below shows the pubsub HTTP API being called along with polling of any new messages:
Log
time="2023-10-18T21:23:02.836969406Z" level=debug msg="Received batch with 0 events on topic orders, partition 0" app_id=node-app component="pubsub (pubsub.azure.eventhubs/v1)" instance=dapr-pub-sub-examples-node-http--d4np7jq-684c774bb8-ngwl6 scope=dapr.contrib type=log ver=1.11.2-msft-3
time="2023-10-18T21:24:02.841720985Z" level=debug msg="Received batch with 0 events on topic orders, partition 0" app_id=node-app component="pubsub (pubsub.azure.eventhubs/v1)" instance=dapr-pub-sub-examples-node-http--d4np7jq-684c774bb8-ngwl6 scope=dapr.contrib type=log ver=1.11.2-msft-3
time="2023-10-18T21:24:19.343194954Z" level=info msg="HTTP API Called" app_id=node-app instance=dapr-pub-sub-examples-node-http--d4np7jq-684c774bb8-ngwl6 method="POST /v1.0/publish/{pubsubname}/{topic:*}" scope=dapr.runtime.http-info type=log useragent=axios/1.5.1 ver=1.11.2-msft-3
time="2023-10-18T21:24:19.438464479Z" level=debug msg="Received batch with 1 events on topic orders, partition 0" app_id=node-app component="pubsub (pubsub.azure.eventhubs/v1)" instance=dapr-pub-sub-examples-node-http--d4np7jq-684c774bb8-ngwl6 scope=dapr.contrib type=log ver=1.11.2-msft-3
time="2023-10-18T21:24:19.43871775Z" level=debug msg="Processing EventHubs event orders/7e9a5ff4-0c99-4726-7400-a944e4f3c47d (attempt: 1)" app_id=node-app component="pubsub (pubsub.azure.eventhubs/v1)" instance=dapr-pub-sub-examples-node-http--d4np7jq-684c774bb8-ngwl6 scope=dapr.contrib type=log ver=1.11.2-msft-3


