Pod ephemeral storage exceeded with Container Apps
This post will go over messages like “Container exceeded its local ephemeral storage limit” or “Pod ephemeral local storage usage exceeds the total limit of containers”.
Overview
This is a continuation of this blog post - Troubleshooting volume mount issues on Azure Container Apps - and intended to be solely focused on this storage issue in relation to Container Apps and Container App Jobs.
Symptoms
The error messages are typically:
Container exceeded its local ephemeral storage limit"Pod ephemeral local storage usage exceeds the total limit of containers
Symptoms of the errors in this post will typically be that the pod/replica is killed with a reason of Evicted - which will also normally be associated with exit code 137.
To an end-user, this may look like an app or job is “restarting” or exited since pods/replicas are killed (containers in them are forcefully killed by the platform, much typically like what happens in a normal Kubernetes environment), which then a new pod/replica is scheduled and containers in those will be started.
See Container Apps - Demystifying restarts and Container Apps - Backoff restarts and container exits for more information.
Errors and Diagnostics
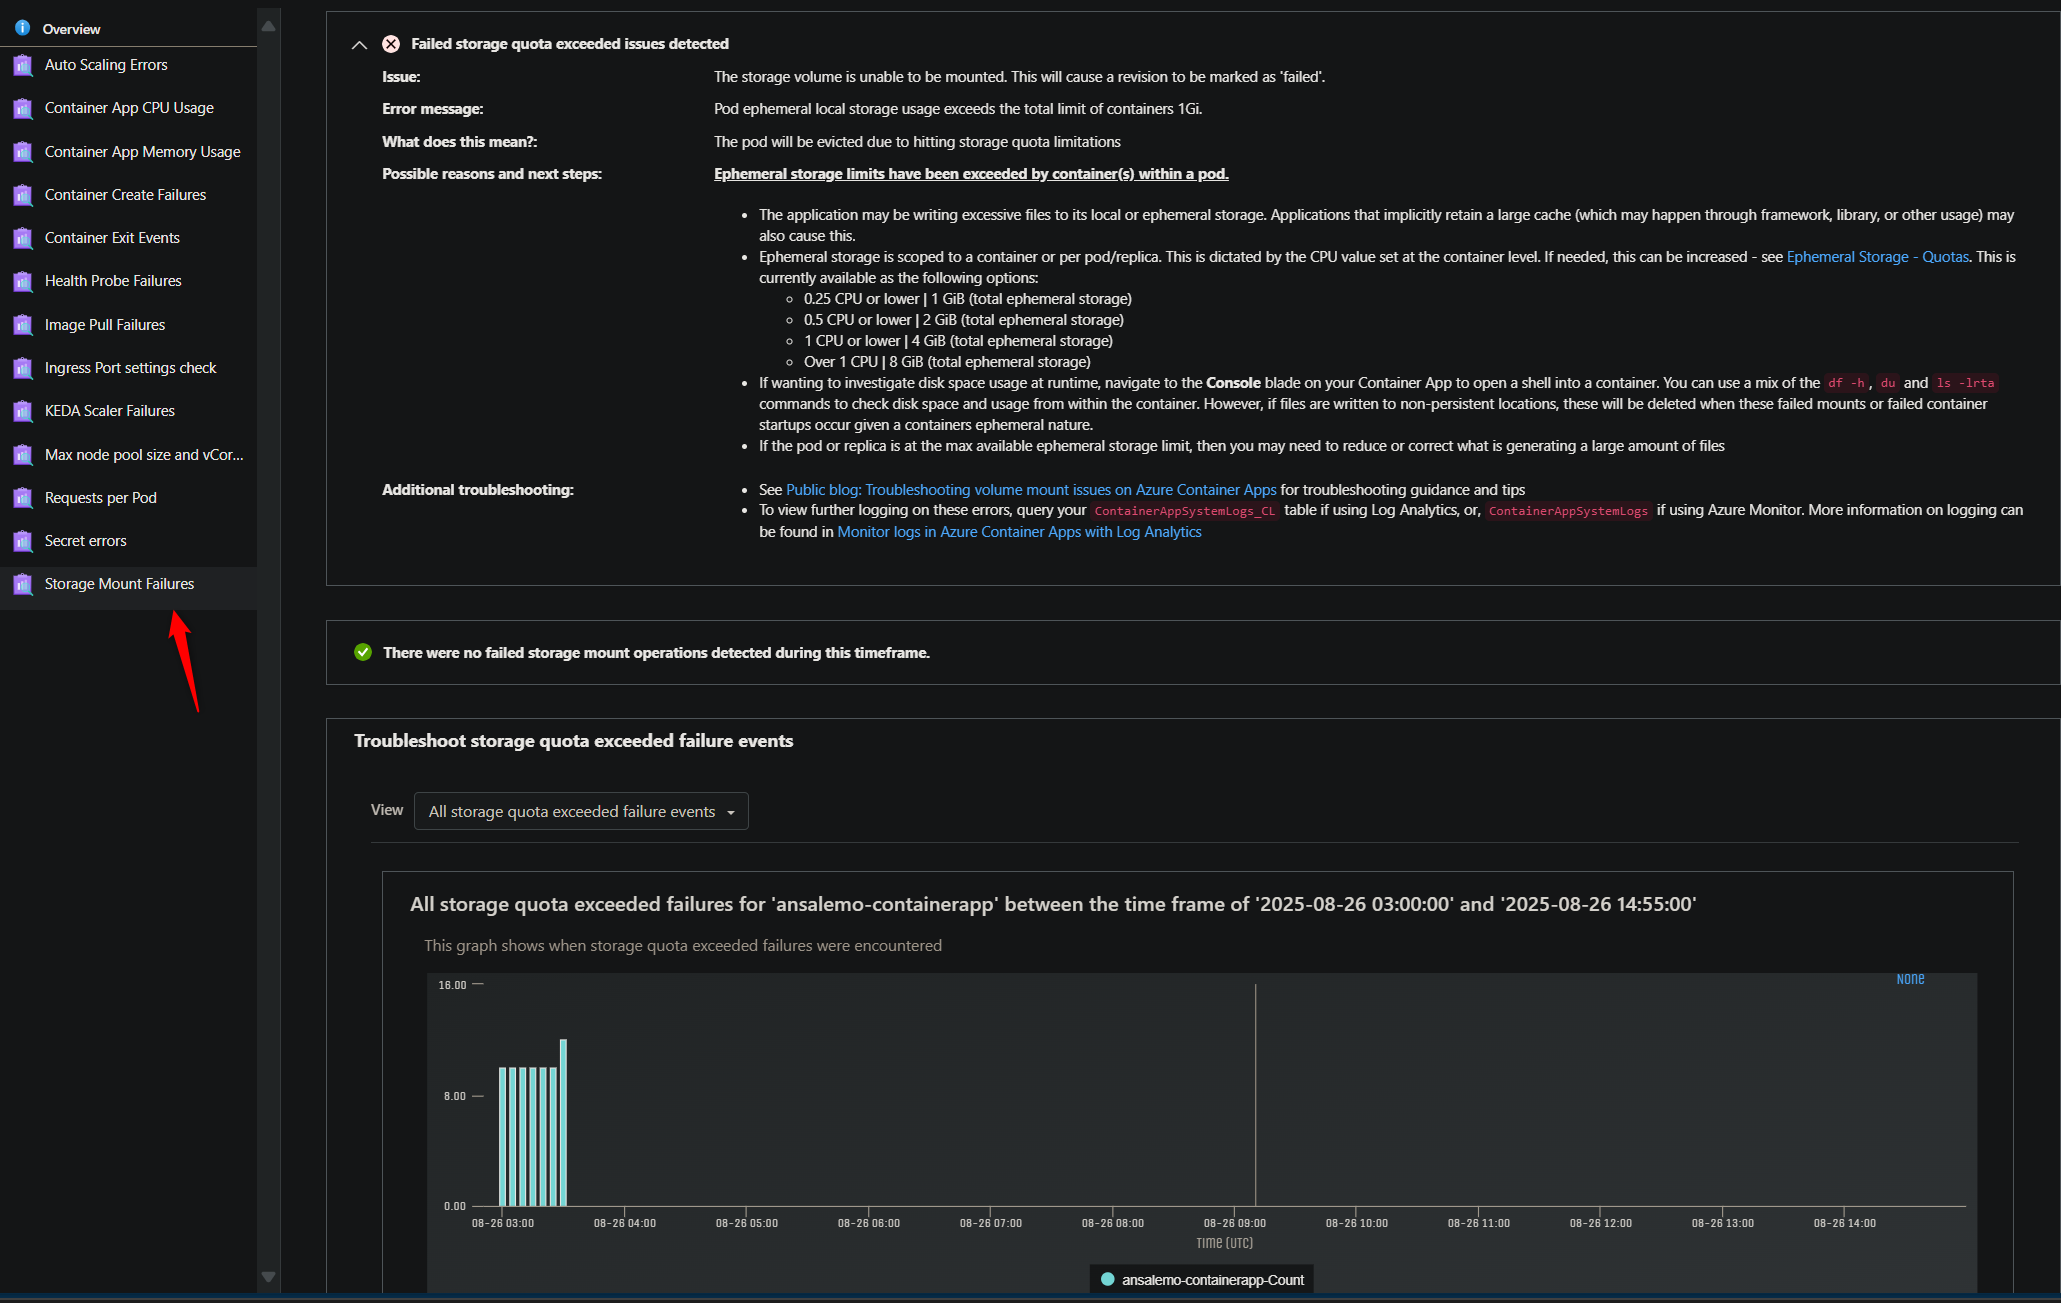
You can find these errors in a few places. The Storage Mount Failures detector in the Diagnose and Solve Problems blade will show if these issues are found. This detector will also display guidance to follow to resolve and/or isolate what is happening in the application to cause this.
This detector exists for Container Apps, Container App Jobs, and Container App Environments - and can all be found in Diagnose and Solve Problems
From a logging perspective, if Azure Monitor is set as the log destination, query the ContainerAppSystemLog table. If Log Analytics is set as the log destination, query the ContainerAppSystemLog_CL table.
If Log Stream is being used, filter for “system” logs.
Expectations before troubleshooting
If your container is already exiting in a pod/replica (and therefor a pod/replica you want to connect to is marked as Failed) you won’t be able to run any Console commands (for Container Apps, since Jobs do not apply)
You need a running container to connect to for Console access. If you see a variation of the error for ‘ClusterExecEndpointWebSocketConnectionError’ when trying to connect via Console, see the blog post for Container App ‘Console’ tab shows ‘ClusterExecEndpointWebSocketConnectionError’
There is no builtin method to tell exactly where or what is consuming disk storage on the file system. Any methods to tell which directory is consuming storage, or, what process/logic is causing this, needs to be written by the end-user.
Ephemeral storage size is based off of CPU allocated to a container, which is called out here
| vCPUs | Total ephemeral storage |
|---|---|
| 0.25 or lower | 1 GiB |
| 0.5 or lower | 2 GiB |
| 1 or lower | 4 GiB |
| Over 1 | 8 GiB |
An application in a container can write to its local filesystem, which is only scoped to the container. Or, an ephemeral mount, which is accessible pod/replica-wide.
- For non-ephemeral mounted volumes, if a container is restarted (eg. a new container is created), any non-persisteted content aside from what the container image includes will be deleted forever
- For ephemeral mounted volumes, this content exists as long as the pod/replica exists. Therefor if a container restarted/exited, etc - but the pod/replica was not deleted, this content will still remain
One commonly tough aspect of troubleshooting this, especially with Container App Jobs, is the timing of doing your troubleshooting to see what is taking up space on disk. When the ephemeral storage space limit is hit, the pod or replicas will be Evicted, therefor any contents will be deleted since the pod is removed. If you have a program accumulating files over time, you may not realize this is happening until after the fact, and checking disk consumption right after pod/replica creation may not show much disk usage especially in “slow leak” scenarios.
Having an understanding of where the application is explicitly writing files (or creating some form of contents on disk) and if there is a chance any implicit creation (like caches, temp files, etc. generated by libraries/frameworks/other software the application uses) needs to be understood if possible.
General troubleshooting and understanding
This is mostly a rehash of what’s taken from Troubleshooting volume mount issues on Azure Container Apps - Pod or container exceeded local ephemeral storage limit
If an application is consistently hitting quota limits, you can:
- Increase
cpusize to be aligned with here, which would increase ephemeral storage. - Or, use Azure Files which would offer increased storage size. However, if there are alot of temporary files or files that don’t need to be persisted - then this option shouldn’t be used as eventually you’d be at risk of filling up this Azure Files quota as well - unless these files are periodically/systematically deleted
- Alternatively, write/introduce logic to delete files that aren’t needed over time.
Tools
CLI tools
Most of the commands used in this blog can be used across either Jobs or Apps although implementation may vary since Jobs does not offer a Console to exec into a container within a pod/replica.
If you want to use these commands to find disk usage on Jobs, it will need to programmatically implemented. See the Jobs section below.
The below commands are referenced through email below in this blog
du(man page) - Displays disk usage for a particular directory.df(man page)- Displays any mounted filesystems/volumes/etc. and how much space is used and availablefind(man page) - This can be used which some extra work to find files and help display usage. This may seem slower to use thanduncdu(linux.die.net page) - This is essentially a terminal-GUI version ofdu, this will only work with Container Apps since this is an interactive command and requires a Console
APMs
APM usage for disk monitoring won’t be covered in this post, but APMs are an easy way for observability, and depending on which APM, for disk usage monitoring.
For example, DataDog offers builtin integration for disk usage monitoring which can possibly save some time and effort with tracking issues down.
APMs should be a consideration in these scenarios. If you’re already using an APM and it doesn’t give me granular details on disk usage in the sense of specific directories consuming space in regards to ephemeral storage errors - you’ll need to use the terminal commands or other-like methods to discern where space is being consumed (aside from reviewing application logic)
Specific troubleshooting
All of the programmatic examples below use a Go application as an example. The same general concept however should fit into most applications, regardless of language.
Container Apps
With Apps, since you have the Console option available (provided your container image comes with a shell, either bash or sh), you can run commands or scripts within the container shell to check and monitor disk usage.
NOTE: If you have an APM set up, this may be an easier bet, especially if it has granularity in the sense of being able to tell which directories are consuming the most space
- Ubuntu/Debian:
du -x -h --max-depth=2 / 2>/dev/null | sort -hr | head -n 50< Largest directories across the whole filesystem- Alpine: If the above doesn’t display anything with an Alpine image, try
du -h -d 1 / 2>/dev/null | sort -hr | head -n 20
- Alpine: If the above doesn’t display anything with an Alpine image, try
- Ubuntu/Debian:
du -sh * 2>/dev/null | sort -hr | head -n 20< Largest directories in the current directory- Alpine: If the above doesn’t display anything with an Alpine image, try
du -h -d 1 . 2>/dev/null | sort -hr | head -n 20
- Alpine: If the above doesn’t display anything with an Alpine image, try
- Ubuntu/Debian:
du -h --max-depth=2 2>/dev/null | sort -hr | head -n 30< Large directories from a recursive search in the current directory- Alpine: If the above doesn’t display anything with an Alpine image, try
du -kh . 2>/dev/null | sort -rn | head -n 20
- Alpine: If the above doesn’t display anything with an Alpine image, try
To run these commands, go to Console, then choose a shell, and connect to a replica. You can run these commands on an as needed basis, or, put them in a loop for easier monitoring. The below example uses du -h -d 1 / 2>/dev/null | sort -hr | head -n 20 in a loop that executes this command every 5 seconds. You can essentially put any of these commands in a loop to run at “x” intervals.
while true; do
    du -h -d 1 / 2>/dev/null | sort -hr | head -n 20
    sleep 5
done
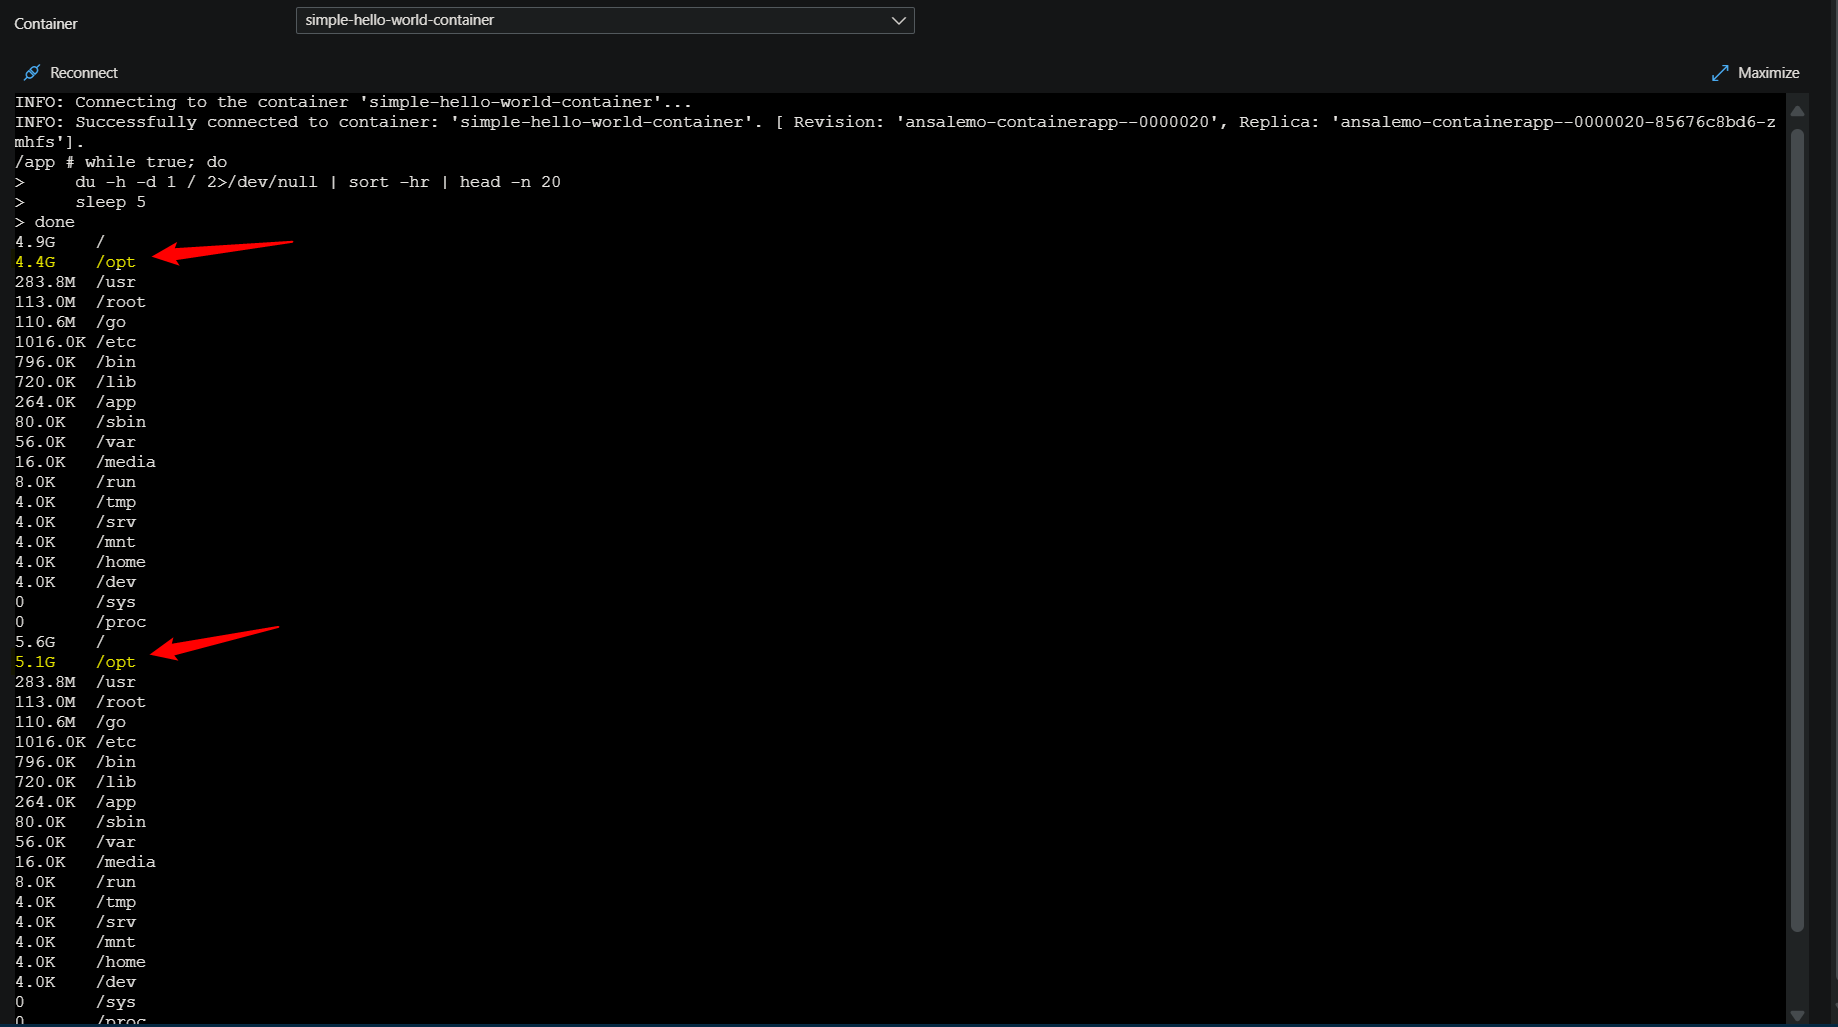
In the above screenshot, we’re running this loop directly as a copy-and-pasted command in the terminal. You can also run it as a .sh file. In our apps case, we can see that /opt is growing about ~0.5GB+ every 5 seconds. You can tweak these commands to filter output down further to just show a specific directory.
Another really easy way to visualize disk usage is with (ncdu) - which is essentially a terminal-GUI based implementation of du.
You can install this with the following:
- Ubuntu/Debian:
apt-get install ncdu - Alpine:
apk add ncdu ncdu-doc
In our case, we’ll run this to look at the filesystem starting from root. Consult the docs above to look at other ways to use this. You can use the “right arrow” and “left arrow” keys to navigate through directories. The r key will refresh usage statistics. The below example shows /opt consuming 5.9GB of space and shows how to navigate into that directory to see what’s in it.
Jobs
As noted above, Jobs, by design, does not offer the Console option to open a shell into the container within the pod/replica. Therefor for looking into the filesystem to find which specific directory may be accumulating files or consuming storage space, leaves you with two general options aside from the Diagnose and Solve Problems blade or the Logs blade to first confirm these errors are happening:
-
- An APM as mentioned above
-
- Running these commands as scripts which requires changes to your image to integrate these
This section will focus on 2. More specifically, running some type of monitor function as a background invoked bash function. This can be done an infinite number of ways, but three possible methods are:
- Invoking a script directly in the
Dockerfile - Invoking a script in a
.shreferenced file for yourENTRYPOINTin yourDockerfile - Using a process manager like
supervisordto handle this
Below is an example of invoking a script only in the Dockerfile:
FROM golang:1.25.0-alpine3.22

WORKDIR /app

# Download Go modules
COPY go.mod go.sum ./
RUN go mod download

COPY . ./

# Build
RUN CGO_ENABLED=0 GOOS=linux go build -o /usr/local/bin/app

# Add an entrypoint that runs the disk-usage monitor in background and then execs the app
RUN cat > /usr/local/bin/monitor-and-run.sh <<'SH'
#!/bin/sh
set -eu

# Run a disk-usage report every 5 seconds in the background
monitor() {
  while true; do
    du -h -d 1 / 2>/dev/null | sort -hr | head -n 20
    sleep 5
  done
}

monitor &

# Exec the main app (pass through any arguments)
exec /usr/local/bin/app "$@"
SH

RUN chmod +x /usr/local/bin/monitor-and-run.sh

# Run
CMD ["/usr/local/bin/monitor-and-run.sh"]
monitor is defined and runs du with additional arguments. Then monitor & is called to run the monitor function in the background.
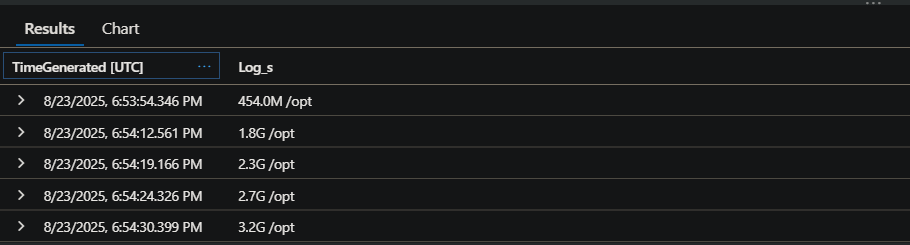
This will print out top level directories starting from root. The application in question is mimicking heavily file writing to a path of /opt/data. We can see here, using the above set up with monitor and the du command, that over the course of almost 2 minutes, /opt/ has grew almost 3GB in size. The below is a query ran in Log Analytics through ContainerAppConsoleLogs_CL, since the output from this kind of custom script will be sent to stdout automatically.
Another example is using ENTRYPOINT in your Dockerfile - this example and the one above will show the same output in console logs since stdout / err is captured. :
FROM golang:1.25.0-alpine3.22

WORKDIR /app

# Download Go modules
COPY go.mod go.sum ./
RUN go mod download

COPY . ./

# Build
RUN CGO_ENABLED=0 GOOS=linux go build -o /usr/local/bin/app
RUN chmod +x /app/entrypoint.sh

# Run
ENTRYPOINT ["/app/entrypoint.sh"]
And then in entrypoint.sh, you’d have something like this:
#!/bin/sh
set -eu

# Run a disk-usage report every 5 seconds in the background
monitor() {
  while true; do
    du -h -d 1 / 2>/dev/null | sort -hr | head -n 20
    sleep 5
  done
}

monitor &

# Run the go job
/usr/local/bin/app
This is conceptually the same as the first example. Although it may be cleaner sometimes to have this logic in its own .sh file.
A last example is with supervisord (or any other kind of process manager). By default, supervisord writes stdout / stderr to /tmp/processname-stdout---supervisor-xxxxxxxx.log (and stderr) equivalent. This doesn’t write to these logs directly to stdout / stderr, so it won’t be captured in Container App logging. You can however capture this output in other ways, such as mounting a volume and writing supervisor logs to a path under that mount.
supervisord.conf:
[supervisord]
nodaemon=true

[program:go]
command=/usr/local/bin/app
autostart=true
autorestart=true

[program:diskmonitor]
command=/app/diskmonitor.sh
autostart=true
autorestart=true
This calls diskmonitor.sh which runs the following function:
#!/bin/sh
set -eu

# Run a disk-usage report every 5 seconds in the background
while true; do
    du -h -d 1 / 2>/dev/null | sort -hr | head -n 20
    sleep 5
done
This is all executed through supervisord.sh:
#!/bin/sh
set -eu

# Invoke our supervisord.conf
/usr/bin/supervisord -n -c /etc/supervisor/conf.d/supervisord.conf
The Dockerfile looks like this:
FROM golang:1.25.0-alpine3.22

WORKDIR /app

# Download Go modules
COPY go.mod go.sum ./
# Install supervisor
RUN go mod download && apk add supervisor

COPY . ./
COPY ./supervisord/supervisord.conf /etc/supervisor/conf.d/supervisord.conf

# Build
RUN CGO_ENABLED=0 GOOS=linux go build -o /usr/local/bin/app
RUN chmod +x /app/supervisord.sh /app/diskmonitor.sh

# Run
ENTRYPOINT ["/app/supervisord.sh"]