Python Performance High CPU Using CProfile
This post will cover troubleshooting a High CPU Performance Issue on Linux Python App Services using CProfile.
Overview
When running your python application on app services you may experience High CPU from your Python Process. To understand the cause of the High CPU you can use CProfile to profile your python code.
Reference Documentations: CProfile
Example
You can find the sample code used in this blog, using the below link.
Reference Sample: Azure Open Source Developer Samples - Cprofile
Symptoms
When we navigate to our app service we notice a slower than expected response time when hitting the root endpoint.

This is in conjunction with your python process showing high CPU, when running the top command.
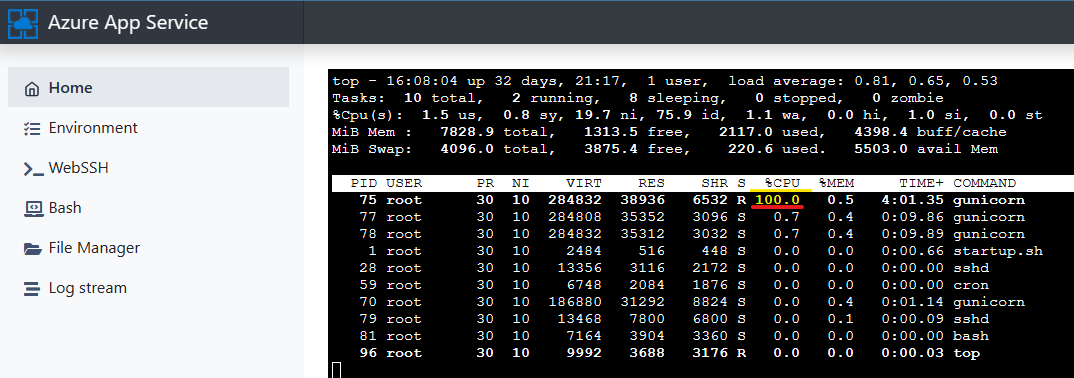
You can view this information either from the SSH console, or viewing the Process List or Process Full List detector using the Diagnose and Solve Problems blade.
Note: If you not seeing any high CPU, but still noticing performance issues with simultaneous requests you many want to make sure you optimize your gunicorn settings first and then retest before profiling. More information here: Configuring Gunicorn worker class and other general settings
Implement CProfile
Profiling your application using CProfile will require you to make minimal changes to your code base and redeploy. Below is some sample code that will cause high CPU.
from flask import Flask
import os, time

app = Flask(__name__)
num = 1

def firstMethod():
    secondMethod() #Calling secondMethod
    return "I am done here"

def secondMethod():
    thirdMethod(2.5) #Calling thirdMethod
    for loop in range(1): #CPU time spent
        for index in range(121474838):
            num * index
    thirdMethod(5) #Calling thirdMethod again

def thirdMethod(n):
    time.sleep(n) #Sleep

@app.route("/")
def home():
    result = firstMethod()
    return "%s!" %result

if __name__ == '__main__':
    app.run()
Configuring cProfile
- You need to import the following modules:
import cProfile, pstats, io from pstats import SortKey -
Select the function/method or route that you think it is taking more CPU time. To enable/disable the profile you will need to add the following code
pr = cProfile.Profile() pr.enable() # ... code or function calls you need to profile ... result = firstMethod() # ... ------------------------------------------ ... pr.disable() s = io.StringIO() sortby = SortKey.CUMULATIVE ps = pstats.Stats(pr, stream=s).sort_stats(sortby) ps.print_stats() print(s.getvalue()) - Redeploy your app service code with the above changes.
Reviewing Output
If implemented correctly, the Output of the CProfile states will now be written to stdout. Make sure Application Logging is Enabled on your app service. Then reproduce the issue, and view the lastest default_docker.log files in application logs. The output should be similar to below:
2023-05-15T17:16:11.755675442Z 15 function calls in 35.792 seconds
2023-05-15T17:16:11.755733343Z
2023-05-15T17:16:11.755758143Z Ordered by: cumulative time
2023-05-15T17:16:11.755764044Z
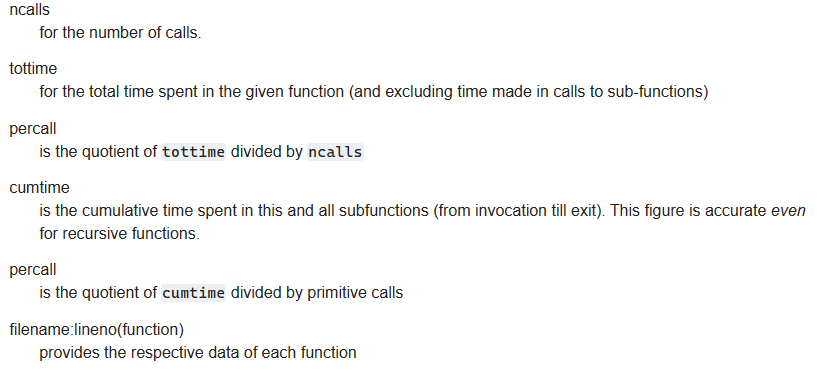
2023-05-15T17:16:11.755769444Z ncalls tottime percall cumtime percall filename:lineno(function)
2023-05-15T17:16:11.755774744Z 1 0.000 0.000 35.792 35.792 /tmp/8db55663d49a3b4/app.py:10(firstMethod)
2023-05-15T17:16:11.755780044Z 1 28.291 28.291 35.792 35.792 /tmp/8db55663d49a3b4/app.py:14(secondMethod)
2023-05-15T17:16:11.755785144Z 2 0.000 0.000 7.500 3.750 /tmp/8db55663d49a3b4/app.py:21(thirdMethod)
2023-05-15T17:16:11.755790544Z 2 7.500 3.750 7.500 3.750 {built-in method time.sleep}
2023-05-15T17:16:11.755795744Z 1 0.000 0.000 0.000 0.000 /opt/python/3.11.2/lib/python3.11/pstats.py:108(__init__)
2023-05-15T17:16:11.755801044Z 1 0.000 0.000 0.000 0.000 /opt/python/3.11.2/lib/python3.11/pstats.py:118(init)
2023-05-15T17:16:11.755806244Z 1 0.000 0.000 0.000 0.000 /opt/python/3.11.2/lib/python3.11/pstats.py:137(load_stats)
2023-05-15T17:16:11.755811544Z 1 0.000 0.000 0.000 0.000 /opt/python/3.11.2/lib/python3.11/enum.py:192(__get__)
2023-05-15T17:16:11.755816745Z 1 0.000 0.000 0.000 0.000 {built-in method builtins.hasattr}
2023-05-15T17:16:11.755821945Z 1 0.000 0.000 0.000 0.000 /opt/python/3.11.2/lib/python3.11/cProfile.py:50(create_stats)
2023-05-15T17:16:11.755827245Z 1 0.000 0.000 0.000 0.000 {built-in method builtins.isinstance}
2023-05-15T17:16:11.755832645Z 1 0.000 0.000 0.000 0.000 {built-in method builtins.len}
2023-05-15T17:16:11.755837845Z 1 0.000 0.000 0.000 0.000 {method 'disable' of '_lsprof.Profiler' objects}
You can then be able to understand which function is most contributing to the cpu utilization, by reviewing the column definitions and comparing them to your output.