Troubleshooting general KEDA scaling scenarios
This post will cover general guidance on troubleshooting some KEDA scaling scenarios
Overview
KEDA (Kubernetes Event-driven Autoscaling) is one of the features of Container Apps. When enabled, you can use one of the numerous scalers to handle horizontal autoscaling of your Container App. Given the huge amount of scalers, and the fact that each require different metaData on setting them up - we’ll cover some general guidance on what to look for if you notice your application is not scaling as desired.
The examples below only use a few scalers out of many. But the concepts talked about can pretty much apply to all KEDA scalers.
Prerequisites and other information
Ensure logging is enabled on the environment. Setting logging to something other than “Don’t save logs” will not persist logs and viewing these will be unstructured to some degree.
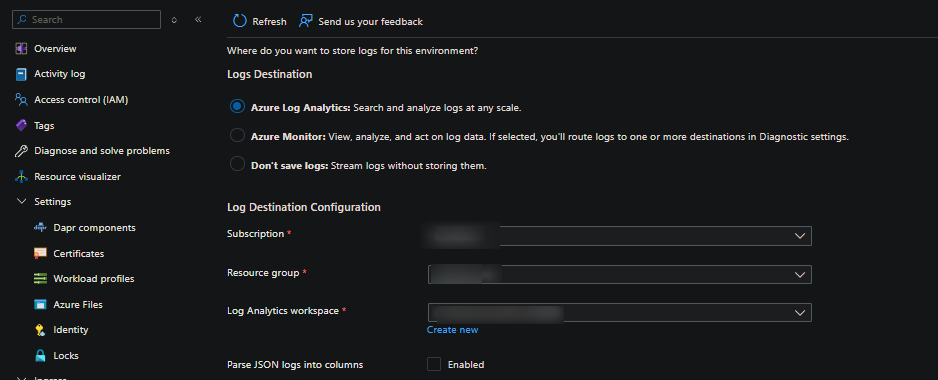
It’s ideal to set the logging option to either Log Analytics or Azure Monitor. For more information see Monitor logs in Azure Container Apps with Log Analytics
KEDA specific:
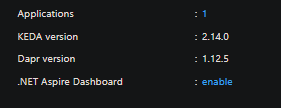
The KEDA version that the environment uses is managed by the platform. You can check which version of KEDA is used by going to your Container App Environment and select Overview in the portal.
It’s recommended that when using a KEDA scaler that the latest documentation is used. Sometimes when navigating to a scaler doc it may not be set to the latest version in the dropdown. Ensure this is done - since for example, if you compare different versions of a scaler, you may notice various changes to parameters between versions. This may cause problems if not paying attention in some cases.
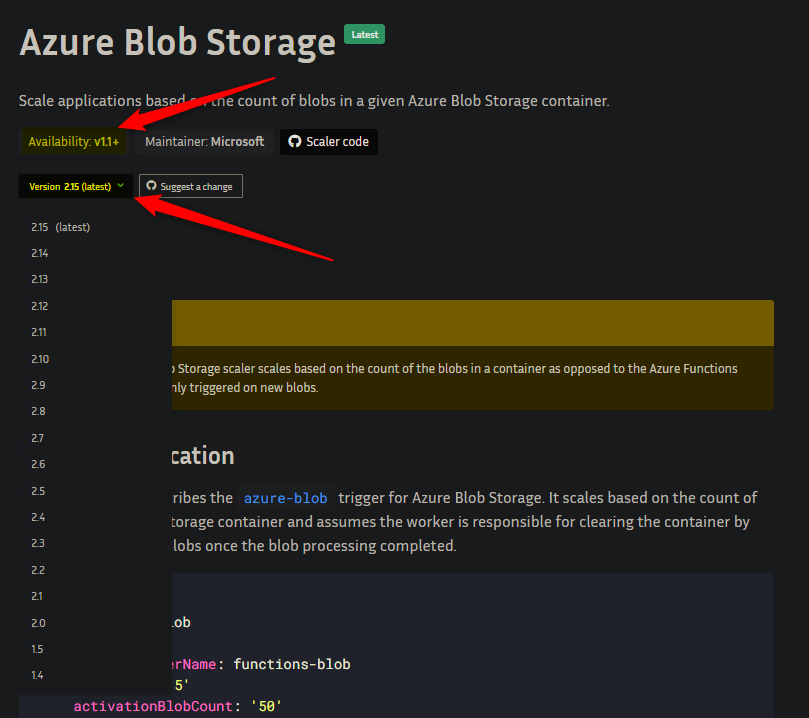
Documentation for scalers also shows “Availability” - meaning which version of KEDA this was first available on. If needed, you can compare the version of this to the KEDA version the environment is currently using.
Behavior
If your application is dependent on scaling through KEDA scalers, aside from errors, you may notice that your deployment isn’t scaling from 0 > n or n > n when there is confirmed “work” for KEDA to act upon.
Additionally, your revision should still show a running status of “Running”.
If this is the case, reviewing system logs is a next step.
KEDA scalers and log output
Missing or incorrect parameters
When encountering an error, this will completely depend on the KEDA scaler being used. When troubleshooting, it’s important to see if you can correlate the error in relation to the metadata that was provided to the scaler. Below is an example query used with Log Analytics. KEDA scaler failures will typically get shown under the Reason_s of KEDAScalerFailed:
ContainerAppSystemLogs_CL
| where Reason_s == "KEDAScalerFailed"
|  project TimeGenerated, ContainerAppName_s, ReplicaName_s, Log_s, Reason_s
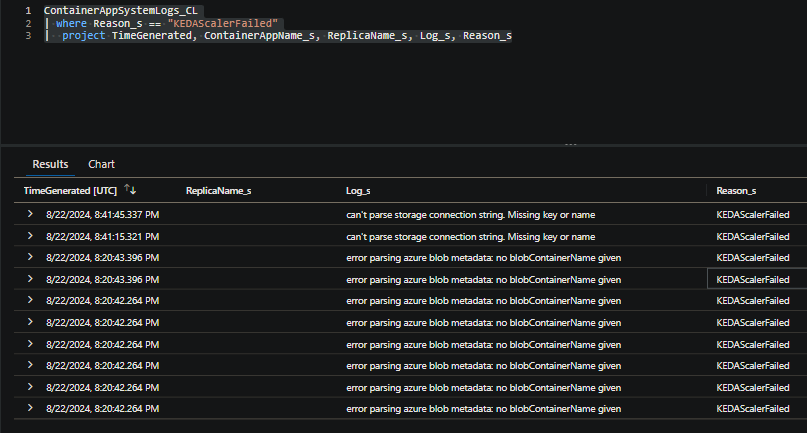
The scaler in the example above is the Azure Blob Storage scaler. We can see two errors, one about a missing parameter named blobContainerName and a malformed or missing connection string.
Below are some other examples with various scalers. We can see the pattern here, all of these will show in ContainerAppSystemLogs_CL / ContainerAppSystemLogs (generally, system logs). Note that there can be any number of errors per scaler, these are just singular examples per scaler:
- Azure Service Bus:
error parsing azure service bus metadata: no connection setting given - Azure Storage Queue:
error parsing azure queue metadata: no connection setting given - Azure Pipelines:
error parsing azure Pipelines metadata: failed to extract organization name from organizationURL - Cron:
error parsing cron metadata: no start schedule specified. - GitHub Runner Scaler:
error parsing GitHub Runner metadata: no runnerScope given - etc.
Note: In terms of authentication on Container Apps with KEDA - this will always either use a connection string as a secret or a managed identity. An example is here. For connection strings, always ensure this is valid based on the service you’re authenticated to. Syntax will vary.
It’s best to review your associated KEDA scaler doc to see which parameter may be called out in the error. If we look in the docs for the blob scaler, we can see the parameter list here:
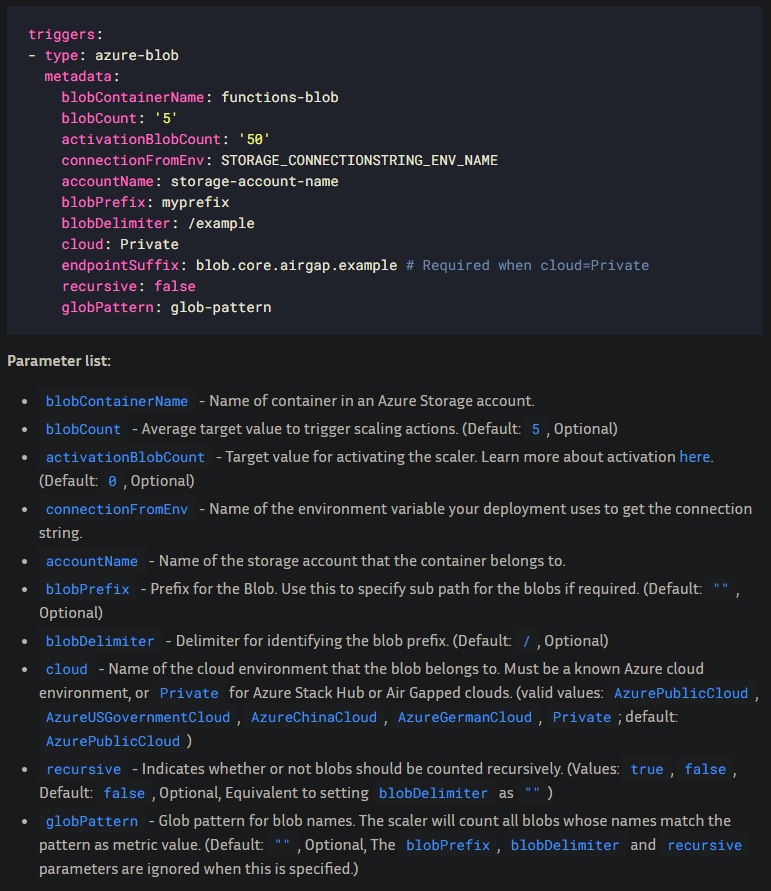
Note the parameters that show “Optional”. The ones that do not show “Optional” are required.
This obviously will vary based on scaler - but you can use this same concept about what is required vs. optional in other scalers. Some scalers will also have parameters that are optional if other parameters are set.
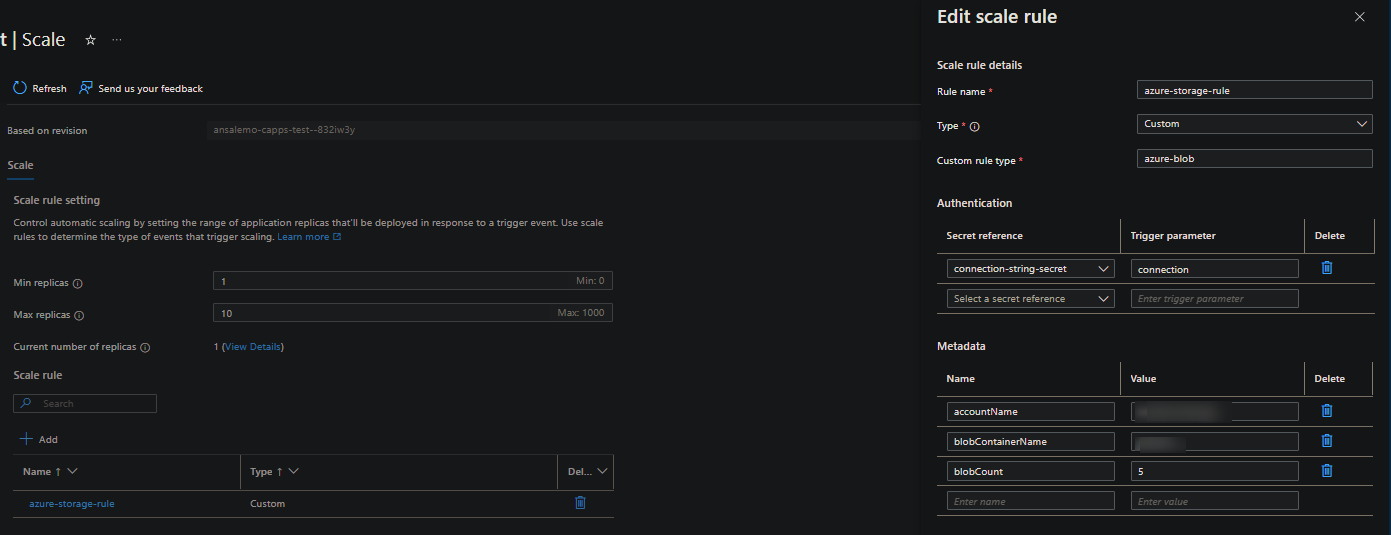
You can then reference to what you have in your scaler. For example, with the Azure CLI through something like az containerapp show -n myapp -g myrg or the Azure Portal under the Scale blade:
Failing to reach the target service
This is a catch all for a few different reasons, but not limited to:
- Connection to the target service is blocked by networking aspects. Such as Private Endpoints on the target service or firewalls enabled.
- DNS resolution failures or the target service name used is incorrect. For example, custom DNS servers that can’t resolve the hostnames provided to KEDA for scaling
Ensure the connection string iself contains the correct hostname of the service you’re calling. Certain scalers may also offer host / hostname / address-like parameters. Ensure these are also correct.
The way this manifests depends on the scaler and service, but there is a common theme here as well. Below are some examples:
- Azure Pipelines - this message typically is associated with connectivity to the resource being blocked (eg. firewall or NVA through a UDR)
error parsing azure Pipelines metadata: Get "https://dev.azure.com/someorg/_apis/something/pools?poolName=some-pool": context deadline exceeded (Client.Timeout exceeded while awaiting headers) - Redis - Name resolution failure (due to DNS or incorrect hostname provided)
connection to redis failed: dial tcp: lookup test on 100.xxx.xxx.xx:53: no such host - Azure Service Bus - Name resolution failure (due to DNS or incorrect hostname provided)
Get "https://wlx-prod-gcc-ct-messages.servicebus.windows.net/wlx-prod-gcc-ct-product-messages/Subscriptions/o-product-upd-subscription?api-version=2021-05": dial tcp: lookup wlx-prod-gcc-ct-messages.servicebus.windows.net on xxx.xxx.xxx.xxx:53: no such host -
Kafka - Name resolution failure
error creating kafka client: kafka: client has run out of available brokers to talk to: dial tcp xx.xx.xxx.xx:xxx: i/o timeout
You can use the “quickstart” image on Container Apps (which uses Mariner) or your own to test if the remote services that KEDA is scaling from is accessible. Installing troubleshooting tools in a Container Apps ‘hello-world’ image can be followed on how to install dig / nslookup and others inside a container, which can be used for scenarios that resemble name resolution failures.
For errors that seem to indicate timeouts like context deadline exceeded - using nc or tcpping can be used to see if the remote service is able to accept connections.
Resources not found and possible ‘silent’ errors
“sub” resources of the scaler being used, such as storage containers, queues, non-existing repo’s or others - will prevent properly KEDA scaling.
These will typically show in system logs, below are some examples of various errors:
- Azure Service Bus
github.com/Azure/azure-storage-queue-go/azqueue.newStorageError, /workspace/vendor/github.com/Azure/azure-storage-queue-go/azqueue/zc_storage_error.go:42 ===== RESPONSE ERROR (ServiceCode=QueueNotFound) ===== Description=The specified queue does not exist. RequestId:00000000-0000-0000-0000-000000000000 Time:2024-08-23T05:24:38.8431240Z, Details: Code: QueueNotFound - GitHub Runner Scaler:
the GitHub REST API returned error. url: https://api.github.com/orgs/someorg/repos status: 404 response: {"message":"Not Found","documentation_url":"https://docs.github.com/rest/repos/repos#list-organization-repositories","status":"404"}
Key points:
- Confirm the values of relevant parameters in your scaler target resources that actually exist
- Always vet that these resources do exist within the target resource
- It is possible for that for some specific scaler subresources, that no error is seen if a subresource doesn’t actually exist.
Authentication
You can authenticate via secrets (connection string), or, with services hosted within Azure, you can use Managed Identity
Some common problems ran into is:
- Incorrect connection string (wrong syntax, username, password, host, etc.)
- Credentials being reset on the remote service will not update the connection string used by KEDA on Container Apps. You must manually update this
- Always double check the credentials being used. If creating or updating scalers from a terminal - make sure that special characters in your string are not terminating the connection string early. You can
echothe connection string beforehand to check if it’s correct.
- Incorrect permissions or the scope is incorrect
- Target services that can be used by managed identity will vary, given the number of products that exist within Azure.
- These also may have different permissions and is not exactly a one-size-fits-all methodolgy in terms of permissions required for the resource. Review the associated target resources documentation to see what permissions may be required for Managed Identity usage. Double check the permissions granted to the Managed Identity and under which scope.
Below are some examples you may see in system logs:
- Azure Service Bus:
GET https://mysb.servicebus.windows.net/someque -------------------------------------------------------------------------------- RESPONSE 401: 401 Unauthorized ERROR CODE: 401 -------------------------------------------------------------------------------- - GitHub Runner Scaler:
the GitHub REST API returned error. url: https://api.github.com/repos/somerepo/someorg/actions/runs status: 401 response: {"message":"Bad credentials","documentation_url":"https://docs.github.com/rest","status":"401"} - Azure Storage Queue:
  github.com/Azure/azure-storage-queue-go/azqueue.newStorageError, /workspace/vendor/github.com/Azure/azure-storage-queue-go/azqueue/zc_storage_error.go:42
  ===== RESPONSE ERROR (ServiceCode=AuthenticationFailed) =====
  Description=Server failed to authenticate the request. Make sure the value of Authorization header is formed correctly including the signature.

  ...
  ===== RESPONSE ERROR (ServiceCode=KeyBasedAuthenticationNotPermitted) =====
  Description=Key based authentication is not permitted on this storage account.
Typically the theme is HTTP 401/403 or Unauthorized / Authentication failed/failure.
Other
KEDA activation:
Scalers have a parameter for activation (the naming will vary). This should show within the parameter list on the scaler. Most (if not all) may have a low count, typically 0. Using the Azure Blob Storage example again, the definition for this is:
activationBlobCount - Target value for activating the scaler. Learn more about activation here. (Default: 0, Optional)
Reading further, here is some of the description for “Activation phase”:
Activation phase: The activating (or deactivating) phase is the moment when KEDA (operator) has to decide if the workload should be scaled from/to zero. KEDA takes responsibility for this action based on the result of the scaler IsActive function and only applies to 0<->1 scaling. There are use-cases where the activating value (0-1 and 1-0) is totally different than 0, such as workloads scaled with the Prometheus scaler where the values go from -X to X.
Based on this (and what else is descried in the above link), for scalers where activation is 0 (the default), you may see your current active replica count go to 1 - even if you have other parameters for scaling like blobCount (as an example) and even if that criteria hasn’t been met yet - since this primarily handles 0 -> 1 scaling. The other parameters would account for the Scaling phase - which is 1 -> n and when HPA takes over.
As always, read through your associated scaler docs for more information. However generally, if you only want to have KEDA handle 0 -> 1 scaling only when a certain number of work is hit - set your scalers activation count to be higher.
API Rate limiting:
This has mostly been seen for GitHub runners so far, since the requests KEDA makes is to the GitHub API endpoint. This will surface in system logs as GitHub API rate limit exceeded, resets at YYY-MM-DD HH:MM:SS +0000 UTC
For GitHub, you can review it’s rate limits here - Rate limits for the REST API. If this is activated, up until reset time, scaling may not occur by KEDA (or HPA if already at 1 pod)
There is a possibility this happens with other scalers who may have requests made to it through an API.
Local testing
It is also possible to test KEDA scaling locally before deploying to Container Apps - or - the reverse, to troubleshoot behavior that may be seen on Container Apps with KEDA (note, this will not be an exact 1:1 with the platform)
You can follow this post - Running self-hosted agent Jobs locally with KEDA for Container Apps - which covers installing KEDA through Helm into a single-node Kubernetes cluster enabled through Docker Desktop.


